Stack overflows are a big problem: If I see a system crash, the first thing usually is I try to increase the stack size to see if the problem goes away. The GNU linker can check if my global variables fit into RAM. But it cannot know how much stack I need. So how cool would it be to have a way to find out how much stack I need?
And indeed, this is possible with the GNU tools (e.g. I’m using it with the GNU ARM Embedded (launchpad) 4.8 and 4.9 compilers :-). But it seems that this ability is not widely known?
Overview
One approach I have used for a very long time is:
- Fill the memory of the stack with a defined pattern.
- Let the application run.
- Check with the debugger how much of that stack pattern has been overwritten.
That works pretty good. Except it is very empirical. What I need is some numbers from the compiler to have a better view.
In this article I present an approach with GNU tools plus Perl script to report the stack usage in the application.
GNU -fstack-usage Compiler Option
The GNU compiler suite has an interesting option: -fstack-usage
“A unit compiled with
-fstack-usagewill generate an extra file that specifies the maximum amount of stack used, on a per-function basis. The file has the same basename as the target object file with a.suextension.” (https://gcc.gnu.org/onlinedocs/gnat_ugn/Static-Stack-Usage-Analysis.html)
If I add that option to the compiler settings, there is now a .su (Stack Usage) file together with each object (.o) file:
The files are simple text files like this:
main.c:36:6:bar    48    static
main.c:41:5:foo    88    static
main.c:47:5:main    8    static
It lists the source file (main.c), the line (35) and column (5) position of the function, the function name (bar), the stack usage in bytes (48) and the allocation (static, this is the normal case).
Creating Stack Report
While the .su files already is a great source of information on a file/function basis, how to combine them to get the full picture? I have found a Perl script (avstack.pl) developed by Daniel Beer (see http://dlbeer.co.nz/oss/avstack.html).
From the original script, you might need to adapt the $objdump and $call_cost. With $objdump I specify the GNU objdump command (make sure it is present in the PATH) and $call_cost is a constant value added to the costs for each call:
my $objdump = "arm-none-eabi-objdump";
my $call_cost = 4;
Call avstack.pl with the list of object files, e.g.
avstack.pl ./Debug/Sources/main.o ./Debug/Sources/application.o
💡 You need to list all the object files, the script does not have a feature to use all the .o files in a directory. I usually put the call to the Perl file into a batch file which I call from a post-build step (see “Executing Multiple Commands as Post-Build Steps in Eclipse“).
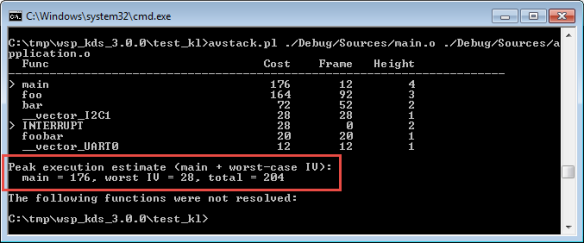
This generates a report like this:
  Func                               Cost    Frame   Height
------------------------------------------------------------------------
> main                                176       12        4
  foo                                 164       92        3
  bar                                  72       52        2
> INTERRUPT                            28        0        2
  __vector_I2C1                        28       28        1
  foobar                               20       20        1
R recursiveFunct                       20       20        1
  __vector_UART0                       12       12        1

Peak execution estimate (main + worst-case IV):
  main = 176, worst IV = 28, total = 204
- The function names with a ‘>’ in front show ‘root’ functions: they are not called from anywhere else (maybe I have not passed all the object files, or are really not used).
- If the function is recursive, it is marked with ‘R’. The cost estimate will be for a single level of recursion.
- Cost shows the cumulative stack usage (this function plus all the callees).
- Frame is the stack size used as in the .su file, including
$call_costconstant. - Height indicates the number of call levels which are caused by this function.
Notice the INTERRUPT entry: it is the level of stack needed by the interrupts. The tool assumes non-nested interrupts: it counts the worst case Interrupt Vector (IV) stack usage to the peak execution:
Peak execution estimate (main + worst-case IV):
  main = 176, worst IV = 28, total = 204
What is counted as interrupt routine is controlled by this part in the Perl script, so every function starting with __vector_ is treated as interrupt routine:
# Create fake edges and nodes to account for dynamic behaviour.
$call_graph{"INTERRUPT"} = {};

foreach (keys %call_graph) {
    $call_graph{"INTERRUPT"}->{$_} = 1 if /^__vector_/;
}
Assembly Code
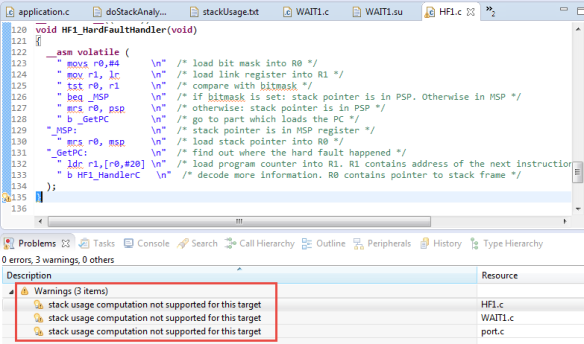
If I have inline assembly and assembly code in my project, then the compiler is not able to report the stack usage. These functions are reported with ‘zero’ stack usage:
  Func                               Cost    Frame   Height
------------------------------------------------------------------------
> HF1_HardFaultHandler                  0        0        1
The compiler will warn me about it:
💡 I have not found a way to provide that information to the compiler in the source.
RTOS Tasks
The tool works nicely and out-of-the box for tasks in an RTOS (e.g. FreeRTOS) based system. So with the tool I get a good estimate of each task stack usage, but I need to count to that value the interrupt stack usage:
  Func                               Cost    Frame   Height
------------------------------------------------------------------------
> ShellTask                           712       36       17
-Wstack-usage Warning
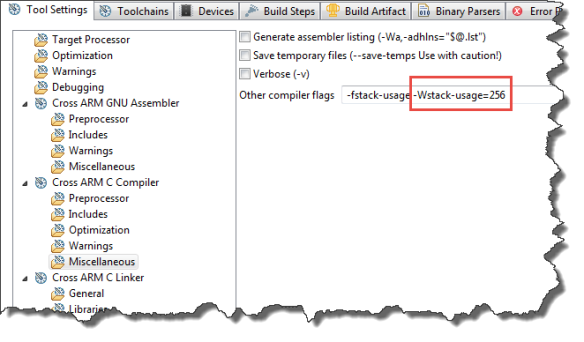
Another useful compiler option is -Wstack-usage. With this option the compiler will issue a warning whenever the stack usage exceeds a given limit.
That way I can quickly check which functions are exceeding a limit:
Summary
The GNU compiler suite comes with the very useful option -fstack-usage which produces text files for each compilation unit (source file) listing the stack usage. These files can be processed further, and I’m using the great Perl script created by Daniel Beer (Thanks!). With the presented tools and techniques, I get an estimate of the stack usage upfront. I’m aware that this is an estimate only, that recursion is only counted at a minimum level, and that assembly code is not counted in. I might extend the Perl file to scan folders for all the object files in it, unless someone already did this? If so, please post a comment and share :-).
Happy Stacking 🙂
UPDATE 24-Aug-2015: For all the C++ users: Daniel Beer has updated his article on http://www.dlbeer.co.nz/oss/avstack.html.
Links
- GNU
-fstack-usageoption (GNU Ada Page): https://gcc.gnu.org/onlinedocs/gnat_ugn/Static-Stack-Usage-Analysis.html - Perl script to combine stack usage files by Daniel Beer: http://dlbeer.co.nz/oss/avstack.html
- Paper about stack analysis: http://www.adacore.com/uploads/technical-papers/Stack_Analysis.pdf
- Stack Analysis discussion in StackOverflow: http://stackoverflow.com/questions/126036/checking-stack-usage-at-compile-time
- Maximum stack size discussion in StackOverflow: http://stackoverflow.com/questions/6387614/how-to-determine-maximum-stack-usage-in-embedded-system-with-gcc
- Introcution of
-Wstack-usageoption: https://gcc.gnu.org/ml/gcc-patches/2011-03/msg01992.html


This looks very useful. Have you compared the results from the GNU stack usage option method against the empirical approach?
LikeLike
It matches very well. As said in the article, it counts recursion in a minimal way (I avoid recursion anyway) and does not cover assembly code (which I do not have much). The $call_cost is many times too pessimistic.
LikeLike
Software !!?? Have memory protection in the ARM(hardware protection) ? …. Cortex MMU ARM
LikeLike
MMU is a cool thing. But better if you know in advance, right?
LikeLike
Thanks for the tip.
If you don’t want to type on all of the object files you can do something like this:
avstack.pl `find Release -name *.o`
If you are doing this in Eclipse then you would replace Release with the path to your Release (or Debug directory).
Also as an aside, I was running avstack.pl on Cygwin where it promptly died because of a carriage return that was being generated by objdump.
The solution was just to remove any carriage returns in the calling function:
Around line 94:
if (/: R_[A-Za-z0-9_]+_CALL[ \t]+(.*)/) {
my $t = $1;
$t =~ s/\r//g; #New -> remove carriage returns
if ($t eq “.text”) {
$t = “\@$objfile”;
} elsif ($t =~ /^\.text\+0x(.*)$/) {
$t = “$1\@$objfile”;
}
$call_graph{$source}->{$t} = 1;
}
LikeLike
Thanks for posting that tip with the find command!
LikeLike
How we can pass the file ObjectList’s(generated by makefile.def) content to this script as input ?
LikeLike
I think the simplest way would be to have another script which combines the object list with a call to the avstack.pl
LikeLike
Thank you very much for this post, Erich!
Daniel Beer says ” .. This is calculated for each function as the maximum stack usage of any of its callees, plus its own stack frame, plus some call-cost constant (not included in GCC’s analysis).”
How do we know what ‘-fstack-usage’ includes or not in its output? is there some documentation about how these compiler options works? I was looking for that information but I haven´t found anything yet.
Would you show your batch file where you call the perl script and pass the objects list?
Thank you in advance!
Alex
LikeLike
Hi Alex,
Hi Alex,
GCC simply knows the amount of local variables/stack in the compiler internal data structure, while allocating the local variables and temporary variables. To really know what is included or not you need to check the disassembly code, because it might differ from compiler to compiler. My finding is that it does not include the amount of stack needed which is added by the call instruction itself. This is not a big issue with ARM if the BX or BL instruction is used, as the return address is in the link register and not pushed on the stack.
A batch file content how you could call the perl script is something like this:
avstack.pl ./Debug/Sources/main.o ./Debug/Sources/application.o
Simply add your own object files to it.
Have a look at the .bat file here: https://github.com/ErichStyger/mcuoneclipse/tree/master/Examples/KDS/FRDM-K64F120M/FRDM-K64F_Demo
LikeLike
Hi Erich,
i get a proble.
The avstack.pl doesn’t work correctly, when i compile my code using gcc.
the result of Height will always 1,and the call path is also wrong.
Is there something i have to edit?
Thank you for you working.
LikeLike
you have to call the avstack.pl with a list of object files, see the .bat file in https://github.com/ErichStyger/mcuoneclipse/tree/master/Examples/KDS/FRDM-K64F120M/FRDM-K64F_Demo.
If you are not providing any object files, then the height indeed is only one (because you have not supplied all the needed information.
I hope this helps,
Erich
LikeLike
Hi Erich,
I used the perl script with a batch file similar to yours. I used it for a FreeRTOS application. It seems to work fine on a individual function basis. However it does not tell me the stack usage of a function that calls other functions. So my result file contains only ‘root’ entries with an initial ‘>’. The entries for my tasks, that call some functions, are not having ‘child’ entries like in your example with foo and bar.
So I can further examine by hand. However, it would be nice if the script will do the job for me. Do you have any hint what is not working in my case?
Best Regards
Markus
LikeLike
Hi Markus,
not sure what the problem could be, it seems to work well on my side. Maybe it is a problem of your Perl (I’m using Strawberry Perl) or your script. I have my script and files posted here: https://github.com/ErichStyger/mcuoneclipse/tree/master/Examples/KDS/FRDM-K64F120M/FRDM-K64F_Demo
I hope this helps,
Erich
LikeLike
Hi Erich,
I checked one more time and still get just every function listed on its own. But not with the accumulated numbers for each function call if there is another function call within.
The script is the same for both of us. I also changed to Strawberry Perl. I assume it is more related to a compiler (optimization?) switch.
Best Regards
Markus
LikeLike
Hi Markus,
I’m not using any special optimizations, so it must be something else?
Maybe the compiler version? Are you using Kinetis Design Studio v3.2.0 too?
LikeLike
To pass the object list files. You can create a windows batch file like this:
set “OFILES=”
FOR /R %WORKSPACE%\Your_Debug_Folder\ %%G IN (*.o) DO (
ECHO [Batch] Adding %%G to analysis
SET OFILES=!OFILES! %%G
)
avstack.pl !OFILES!
LikeLike
This is handy, thanks Erich.
There are also ways to monitor stack usage in real time. I’ve used the following trick on an ATmega processor, with success:
https://www.avrfreaks.net/forum/soft-c-avrgcc-monitoring-stack-usage
For a Kinetis MCU running FreeRTOS we have used FRTOS1_uxTaskGetStackHighWaterMark. Good for self-test on critical systems.
Cheers
LikeLike
Hi Rhys,
I have used a defined stack pattern in most projects, and for critical ones I have added a watchpoint to the end of the stack too to detect an overflow. The FreeRTOS uxTaskGetStackHighWatermark() is good too, but it is only set at context switch time, so it is possible to miss an overflow that way (see as well https://mcuoneclipse.com/2018/05/21/understanding-freertos-task-stack-usage-and-kernel-awarness-information/). The FreeRTOS stack overflow hook is something I have turned on for all my projects: it works very well, but here again there are some rare cases where an overflow cannot be detected.
LikeLike
Hi erich,
you mentioned
“”I have used a defined stack pattern in most projects, and for critical ones I have added a watchpoint to the end of the stack too to detect an overflow”” .
can you please provide the source code to implement stack painting and watermarking technique.
i am trying to implement the same technique on IMX6SX sabre board which is simulated on kile microvision5 (or) on STM32F407VG board emulated with QEMU on eclipse.
i have asked about same on stack overflow.
stackoverflow.com/questions/71816900/c-code-to-paint-an-embedded-stack-with-a-pattern-say-0xabababab-just-after-mai
stackoverflow.com/questions/71810599/dynamic-stack-analysis-using-footprint-pattern-filling-watermarking-method
Thank you!
LikeLiked by 1 person
I’m heavily leveraging FreeRTOS stack overflow detection for this, see https://www.freertos.org/Stacks-and-stack-overflow-checking.html. Or see how I’m using stack canaries with gcc compiler: https://mcuoneclipse.com/2019/09/28/stack-canaries-with-gcc-checking-for-stack-overflow-at-runtime/
LikeLiked by 1 person
Thanks for the reply,
I have read online that FreeRTOS stack overflow detection works great for thread stack but this can’t be applied to main stack of the application or “can we use FreeRTOS stack overflow detection for main stack as well” ?
https://www.keil.com/appnotes/files/apnt_316.pdf (please check page 6 of 14).
That’s why I was asking for footprint analysis to detect stack overflow of main stack.
we use IMX6SX sabre board (cortex-M4) for our office project at NXP.
Thank you!
LikeLiked by 1 person
Yes, the FreeRTOS way out of the box only works for FreeRTOS threads. But you can use the exact same way in a bare metal environment too: a) fill the end of the stack with a pattern b) call the check routine either manually in the application or us the gcc compiler to call the canary checks.
LikeLiked by 1 person
Pingback: New NXP MCUXpresso IDE v11.0 | MCU on Eclipse
Hi Erich, thanks for the post.
you mentioned one way you used to check stack usage is by
1)Fill the memory of the stack with a defined pattern.
2)Let the application run.
3)Check with the debugger how much of that stack pattern has been overwritten.
I am trying to apply stack painting technique for a simple recursive program (that can potentially overflow the stack) on IMX6SX sabre board which is simulated on kile microvision5 (or) on STM32F407VG board emulated with QEMU on eclipse. I want to check on small program first and apply it for office project if results are good.
Find more about it from my questions on stack overflow.
1) stackoverflow.com/questions/71810599/dynamic-stack-analysis-using-footprint-pattern-filling-watermarking-method
2) stackoverflow.com/questions/71816900/c-code-to-paint-an-embedded-stack-with-a-pattern-say-0xabababab-just-after-mai
as a new bee to embedded programming i am finding it difficult to do this.
Do you have any working code or open source project that implements stack painting technique to check the stack usage??if yes, can you please share the code.
Thank you!
LikeLiked by 1 person
See my other reply: for example use FreeRTOS stack overflow hooks (https://www.freertos.org/Stacks-and-stack-overflow-checking.html) or the gcc stack canaries: https://www.freertos.org/Stacks-and-stack-overflow-checking.html
LikeLike
Hi Erich, thanks for sharing! Though I understood this approach is only an approximation, but have you wondered how to deal with indirect calls in building the call graph? Function pointers could get passed around everywhere… it is difficult problem but just wanted to know your thoughts. Thank you
LikeLike
Hi Guanying ,
The approach presented here with static analysis is not able to cover cases with function pointers, as except for some corner cases the compiler does not know about it. For that case I’m using gcov (https://mcuoneclipse.com/tag/gcov/) which is a dynamic analysis, but will cover those cases.
LikeLike