This happens several times for me: I have a board running for a while (even for days), and then it crashes or is stuck somewhere. Yes, I usually use a watchdog do recover from that situation. But it would be good to know and debug the problem. With CodeWarrior I had the functionality in the debugger to ‘attach’ or ‘connect’ to a running (stuck/crashed) board. However, with Eclipse/Kinetis Design Studio/GDB this is a different debugger, and not possible. At connection time with the debugger the target does a reset, so I don’t know any more where the application crashed. But now I have a solution, at least with the Segger GDB :-).
Debug Hard Fault Attached Target
Outline
I’m using here Kinetis Design Studio V2.0.0, but it is applicable to any Eclipse with the GNU ARM Eclipse plugins and the Segger GDB Server (e.g. with J-Link debug probe or J-Link OpenSDA firmware). The goal is to be able to connect to a running target, without overwriting the application on the board (attach/connect) so the problem on the board can be inspected with the GNU GDB debugger. That means the GDB connection shall *not* reset the target as it usually does.
Update GNU ARM Eclipse Segger Debug Plugin
Verify that you have the latest GNU ARM Eclipse plugins installed. In Eclipse/KDS, use the menu Help > Install New Software and use the following update site:
gnuarmeclipse.sourceforge.net/updates
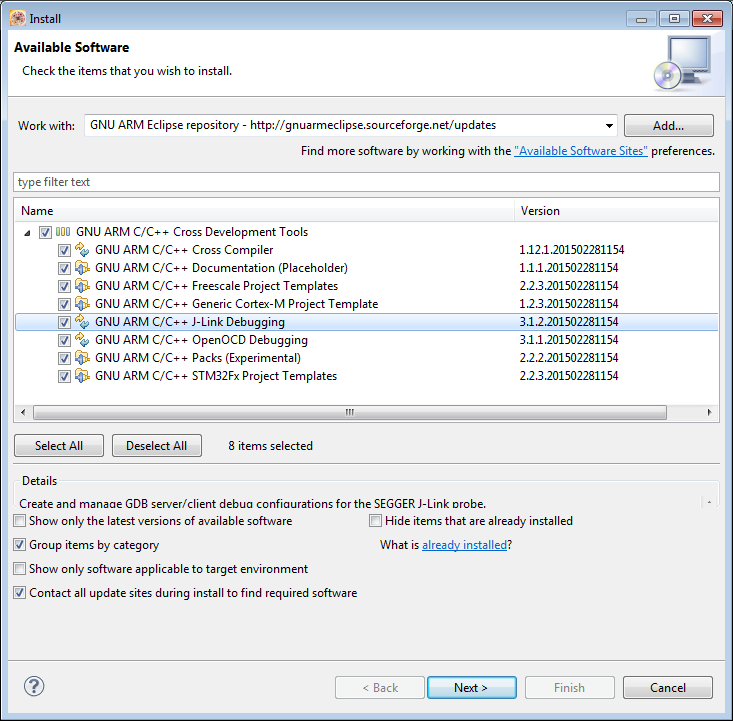
I had to update the GNU ARM C/C++ J-Link Debugging plugins to the version 3.1.2.201502281154 (see above screenshot).
Segger J-Link Debug Panel
This update comes with an important feature: the ‘Connect to running target’ option is now available (it was grayed out and not functional in earlier versions).
💡 Do not forget to switch that off again if you want to debug in a normal way. What I recommend is to have a dedicated debug configuration (you can copy/clone an existing) only for attaching.

Connect to running target
Note that with this option checked, the ‘Load executable’ will automatically disabled/grayed out in the ‘Startup’ tab:
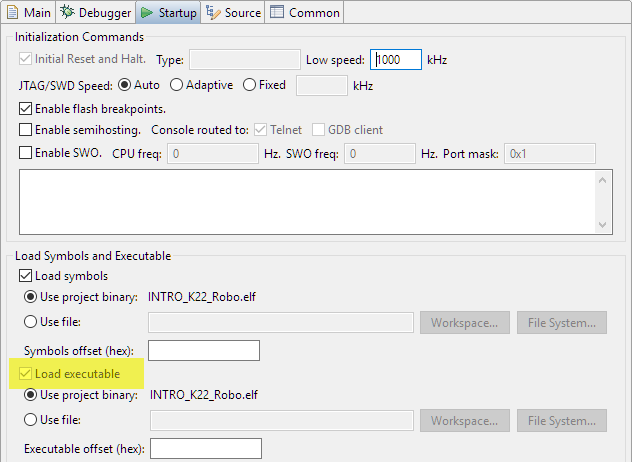
Load Executable disabled
Debugging and Attach
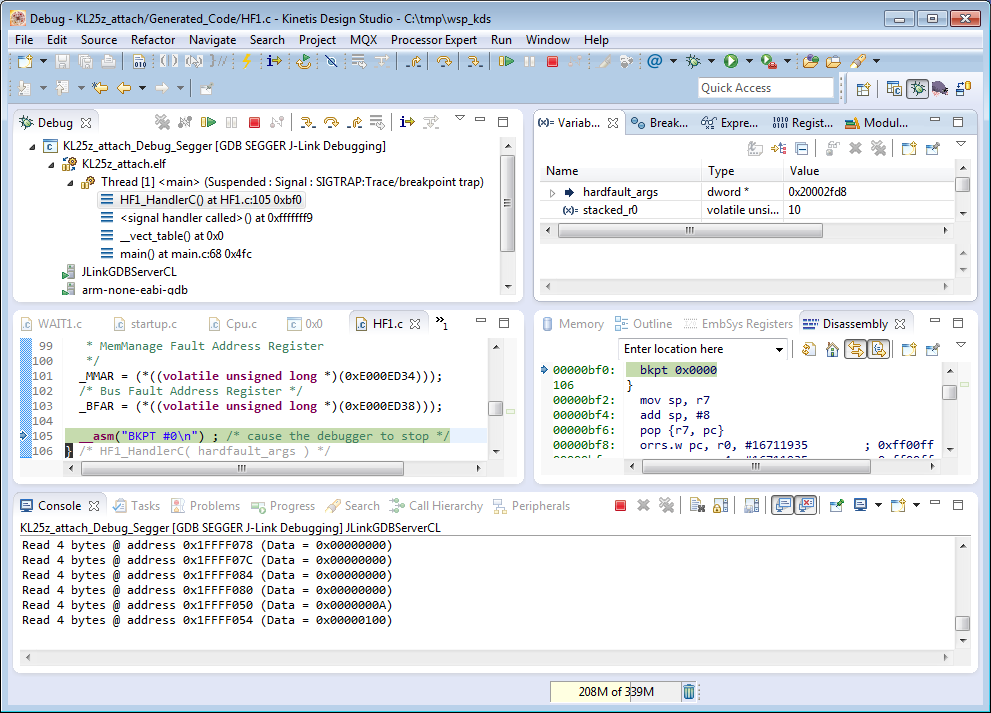
I enable the option ‘Connect to running target’ and I’m able to attach/connect to my target. Use debug as normally, the target will be shown as running), then use the ‘Pause’/Suspend button to stop the target if the target is still running:
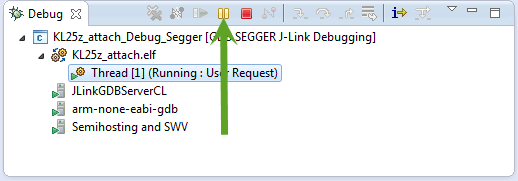
Connected to Running Target
I’m able to successfully attach and debug to my boards with the J-Link (EDU). I’m able to connect the J-Link (EDU) after the crash and to attach/debug it. Using the J-Link ‘Light’ version I had at least to Power the J-Link “Lite” before attaching it to the board, otherwise the board was reset by connecting the SWD/JTAG cable. I recommend you get some practice and experience hooking up the probe. Or (if you can) keep the debug probe powered/attached so you do not risk an accidental reset of the board.
Summary
With the new update and plugin I’m able to debug a crashed application and can connect to the board after the crash to find out what the status of the board is. Thanks to Liviu (the maintainer of the GNU ARM Eclipse plugins) and Segger to make this important feature work with GDB :-).
💡 I think technically the same should be possible with the OpenOCD or GDB P&E Multilink, but I have succeeded doing this only with the GDB Server from Segger.
Happy attaching 🙂
PS: I apologize for being silent for a month. Being overloaded with too many stuff, with rarely time at night to work on new posts. I hope things will get better soon. Stay tuned…. 😉

As always Erich, your post is working great and I appreciate the tips-n-tricks and workarounds.
One note for those attaching using the Segger JLink debugger conntection above….if you have breakpoints set when you attach, the code will stop if it hits a breakpoint. If you do not want to break at a breakpoint, be sure to disable the breakpoints in the Eclispe Debug perspective before trying to grab control.
Regards,
David Seymour
LikeLike
Hi David, thanks 🙂 !
And thanks for that extra tip: indeed, that’s a good one to consider.
LikeLike
Pingback: Updated P&E GDB Server for Eclipse: Connect/Attach and Advanced Flash Programming | MCU on Eclipse
I have a small doubt, where to use the watchdog timer?? Can we use it in Hard fault ISR ??
LikeLike
Not sure I understand your question? You need to serve the watchdog timer (“kick it back”) from your application logic. Not from a hard fault ISR.
LikeLike
Just an aside I was able to attach to a running process using a Freedom KL25 board with USBDM firmware as a debugger. (tl;dr you can load firmware into the K20 on freedom board to turn them into a debugger to use with gdb along with the USBDM Server)
The trick is to start gdb server. The start gdb, I used the following commands.
>arm-none-eabi-gdb
>target remote localhost:1234
>symbol-file elf_file_name.elf
Then on the gdb server window select halt target
You should then be able to use the GDB print print/x commands to inspect memory set break points and look at modify peripheral registers.
LikeLike
I have not used USBDM recently, so thanks for that hint. Are you saying that were then able to use Eclipse to debug the target? Or was it in the GDB console/command line only?
LikeLike
I just use GDB via the command when I need to. In this case to try and figure out why the serial port on my KL16 based device sometimes hangs.
Far as I know USBDM works with Eclipse. I do most of my debugging interactively via a command line interface over a serial port. Since my firmware runs a frequency hopping radio, breakpoints mess up the timing.
Biggest issue with gdb + USBDM is it doesn’t support flash breakpoints (Segger does I think). So you only get 2 hardware break points. Probably could rework the startup code to copy the code you want to debug to RAM and then debug that way.
PS: Your blog is probably the most concentrated source of small embedded system knowledge on the internet.
LikeLike
Yes, Segger J-Link supports ‘unlimited flash breakpoints’. P&E does not. This is a great feature especially for the M0+ devices as they have (as you say) only two HW breakpoints).
PS: thanks 🙂
LikeLike
What is the connection procedure for debugger because usually whenever you connect a debugger, the target resets. How to avoid reset?
LikeLike
The procedure is explained in exactly this article, and it works for me that way in KDS V3.2.0 for example. Make sure you have loaded the latest GNU ARM Eclipse plugins and installed the latest Segger J-Link software from http://www.segger.com.
I hope this helps,
Erich
LikeLike
Erich, thank you for this post, this extremely valuable.
I’m using OpenOcd, KDS and already succeeded to debug a running target with this set up. Then, it’s possible with OpenOcd, by disabling load executable option at debugger configuration, enabling debug in RAM and disabling Initial Reset. Works great.
However, i have a question about this:
I’m facing a challenging situation, since i’m trying to this procedure to a running target that keeps resetting every 5s.
So, is there a way to start a debug session in this condition? Maybe, make the lauching faster to stop at a breakpoint before it resets?
Thank you for your help.
LikeLike
I’ve had this sort of problem before. A trick I’ve used in the past is to put a variable in the no init section in ram.
uint32_t last_line __attribute__ ((section (“.noinit”)));
And then in the code can set
last_line = __LINE_;
AT the begining of the code check if the reset is due to a normal power up or something else. If something else, jump to a safe while loop. Hopefully then you can attach and check the value in last_line. You can then perhaps see where the problem happen.
I also have this in the fault handler. If you a bus fault, fault_pc may tell you where the illegal access was. use arm-none-eabi-addr2line.exe to find the line in the code that matches the address.
uint32_t fault_pc __attribute__ ((section (“.noinit”)));
// Handle hard faults: print debugging information and halt
static void __attribute__((naked)) HardFault_Handler(void)
{
// Set up arguments and invoke _HardFault_Handler()
asm(“mov r0, lr\n” // Arg 0
“mrs r1, psp\n” // Arg 1
“mrs r2, msp\n” // Arg 2
“b _HardFault_Handler\n”);
}
void __attribute__((naked)) _HardFault_Handler(uint32_t lr, void *psp, void *msp)
{
hw_stackframe_t *frame;
// Find the active stack pointer (MSP or PSP)
if(lr & 0x4)
frame = psp;
else
frame = msp;
fault_pc = (intptr_t) frame->pc;
// if pc is 0 likely a null function pointer
if(fault_pc == 0)
{
// get return address
fault_pc = (intptr_t) frame->lr;
}
}
LikeLike
That thing with the last line is really a cool trick, thanks for sharing!
LikeLike
The system initialization at startup code need RTC to proceed?
Thank you for your attention, Erich.
LikeLike
Hi Diogo,
no, the startup code does not need the RTC. But if you have configured the hardware to use the RTC, the RTC needs to be properly powered (e.g. with a battery), otherwise the mikrocontroller will generate a hard fault.
Or in other words: using the RTC without battery power and without clocking the RTC will cause a hard fault. This is expected behaviour of the Kinetis.
LikeLike
I did see an access to a RTC register at system init. This access with the RTC not powered properly could cause this fault and, hence, the reset?
LikeLike
Yes, such a thing cause a hard fault, followed by a reset of the device.
LikeLike
I pretty much stopped using OpenOCD because at least for me it was extremely slow and unreliable. With P&E or Segger I can connect to a target in less than a second, so I don’t phase that problem. I’m not sure what target you are using, but I recommend you give a try with the Segger J-Link: it is available for non-commercial usage for $20 in the EDU version (J-Link MINI EDU).
LikeLike
I agree. I am now able to start a debug session in a second with Multilink probe and P&E. My target is a K64F.
However, i believe breakpoints are not workint properly since, after the bootloader jumps to the application, it does not stops at main function. So i tried to track it down at startup code but the flow there does not make any sense.
Gibbon1, actually this is very interesting, However, i can’t make any change in the code cause i want understand this crash that happens to a very few targets, also this its hard to reproduce. Thank you for your help even so.
LikeLike
If the code flow does not make any sense, then most likely the debug information somehow is not correct (maybe outdated binaries or it uses the wrong .elf for the debug information).
As for the breakpoints: there is a limit of 4 to 5 in the hardare, so don’t set too many breakpoints.
LikeLike
That was actually a hardware issue. Somehow, the RTC battery is causing only the application to crash, even bootloading working fine.
Works properly after replacing RTC battery.
Another question yet about the debugger: Is there a configuration to trigger an initial reset for a P&E debug session? I didn’t see any.
LikeLike
Hi Diogo,
what kind of reset? To my knowledge the P&E probe pulls down the reset line on the SWD connector at reset if you have ‘connect to running target’ disabled in the ‘Startup’ tab of the debug connection.
LikeLike
Tracking down with debugger led me to a line at start up code that is a branch instruction to system init. However, stepping into this branch does not goes to the to system init, instead it goes to a FreeRtos piece of code. I have no clue whyt this happens, also it gets into an if statement AND an else, so it should be a debug error. After this it resets again due to a hardfault i believe.
I did the same procedure at a working running target and i was able to see the flow going to the system init.
Now, i’m trying to figure out why this issue is related to RTC.
Thank you, Erich!
LikeLike
Does the assembly code shown in the disassembly view make any sense? If the assembly code makes sense, it means that the debugger uses the wrong debug (DWARF) information from the .elf file, or the wrong .elf file.
LikeLike
Erich, thank you very much for all attention. Multilink debug probe and P&E saved the day!
LikeLike
Hi Erich,
I’ve been attempting to debug a program running on a MK60DN512xxx10 device. Every time I go to debug with those configurations, GDB server boots and hangs on Waiting for GDB Connection:
SEGGER J-Link GDB Server V6.30b GUI Version
JLinkARM.dll V6.30b (DLL compiled Feb 2 2018 18:36:54)
—–GDB Server start settings—–
GDBInit file: none
GDB Server Listening port: 2331
SWO raw output listening port: 2332
Terminal I/O port: 2333
Accept remote connection: localhost only
Generate logfile: off
Verify download: on
Init regs on start: off
Silent mode: off
Single run mode: on
Target connection timeout: 0 ms
——J-Link related settings——
J-Link Host interface: USB
J-Link script: none
J-Link settings file: none
——Target related settings——
Target device: MK60DN512xxx10
Target interface: SWD
Target interface speed: 1000kHz
Target endian: little
Connecting to J-Link…
J-Link is connected.
Firmware: J-Link Lite-FSL V1 compiled Jun 25 2012 16:40:07
Hardware: V1.00
S/N: 430110131
Checking target voltage…
Target voltage: 3.51 V
Listening on TCP/IP port 2331
Connecting to target…
Connected to target
Waiting for GDB connection…
I’m using JLink_V630b and KDS 3.2.0. Do you have any suggestions as to why this might be?
Thanks,
Max
LikeLike
I’m using the JLnk_V630c with KDS 3.2.0 and a J-Link Lite and don’t have that problem (I though it might be related to the combination fo J-Link Lite and Segger version).
From the log it looks like it is starting the SEGGER GDB server, but it does not get a connection from the ARM gdb server.
Can you check if the arm-none-eabi.exe is running (see as well https://mcuoneclipse.com/2015/05/18/gdb-client-and-server-unlocking-gdb/).
Maybe it helps if you kill that executable in the task manager.
Otherwise check your firewall settings or disable it to see if the this is causing the problems?
LikeLike
Hi Erich,
It seems that arm-none-eabi.exe isn’t launching at all when I click debug.
The GDB Client Setup Executable is set to ${cross_prefix}gdb${cross_suffix} and ${cross_prefix} is defined as “arm-none-eabi-” . Even when I hard path it to the correct .exe, it still isn’t launching. This is really strange because I have a similar project with similar project settings where this works. I turned off all of my antivirus in both scenarios. Do you know why this might still be occurring?
Thanks,
Max
LikeLike
can you try to launch that arm-none-eabi-gdb.exe from the (DOS/cmd) command line?
Just to see if that binary is not corrupted and can be launched. And that it is not blocked by the firewall or any other tools.
LikeLike
Microsoft Windows [Version 6.3.9600]
(c) 2013 Microsoft Corporation. All rights reserved.
>D:\Freescale\KDS_v3\Toolchain\bin\arm-none-eabi-gdb.exe
GNU gdb (GNU Tools for ARM Embedded Processors) 7.6.0.20140731-cvs
Copyright (C) 2013 Free Software Foundation, Inc.
License GPLv3+: GNU GPL version 3 or later
This is free software: you are free to change and redistribute it.
There is NO WARRANTY, to the extent permitted by law. Type “show copying”
and “show warranty” for details.
This GDB was configured as “–host=i686-w64-mingw32 –target=arm-none-eabi”.
For bug reporting instructions, please see:
.
(gdb)
Is what comes up when I run arm-none-eabi-gdb.exe
LikeLike
Ok, I have the same, so this works on that end. Maybe you could send me your launch configuration to that email address listed on the About page of this blog? Maybe I can spot something….
LikeLike
One detail that made this whole process clearer to me: On the [Debugger] tab, when you click “[ ] Connect to running target” on the [Debugger] tab, over on the [Startup] tab, you’ll see that “[ ] Load executable” is automatically unchecked and grayed out. That makes perfect sense…
But a bit of advice from hard-earned experience: don’t forget to UNCHECK “[ ] Connect to running target” if you ever want to load new code. (It took me a while to figure out why my changes weren’t taking effect!) 😛
LikeLike
Hi Robert,
this is all good feedback, thank you! I have updated the article. And yes, I have learned it the hard way too, wasting time trying to debug a target with that option still checked, and I was wondering what is going wrong. I added a note about this too :-).
Thanks again,
Erich
LikeLike
Pingback: Attach with the Debugger to a Running Target | MCU on Eclipse