
Percepio has recently released the v2.7 version of Tracealyzer. This is a major upgrade from the v2.6 version which I have used so far: time to upgrade my Trace component for FreeRTOS to the latest and greatest v2.7!

FreeRTOS+Trace View (V2.7)
New Tracealyzer V2.7
The trace viewer is now available on Linux through Mono, an open source .NET framework supported by most Linux distributions. I have not tried it on Linux yet, but this is for sure great news for anyone using Linux. If you are using the v2.7.0 trace library/components, you have to update the host trace viewer to the latest version which is available for download from the Percepio web site.

FreeRTOS+Trace Viewer V2.7
Event Log View
The new version v2.7 has a new event viewer which shows the events in textual form. That view has powerful filtering capabilities, and data can be exported as text file:

Event Log View
💡 Time stamps can be shown or hidden with the Formatting menu item. That setting is used for the exporting to text files too. That way I can compare two different program traces either with or without time stamp information.
Memory Management Tracing
A really cool feature is the ability to trace the memory calls:

Traced Malloc Calls
To trace the memory allocation/deallocation events, I have to enable that corresponding property in the RTOS trace component:

Including Memory Manager Events
With the Memory Heap Utilization view, I can follow the memory heap usage over time. This already helped me to find and fix a memory leak in one my application code :-).

Memory Heap Utilization
Generation of GDB Memory Dump Command
The default operation mode with tracing is
- Set a breakpoint on the ‘trace full’ hook method
- Program stops on that breakpoint
- Dump the trace data to a file with the debugger
💡 If using a Segger J-Link, then things are even easier, as the Tracealyzer application can directly talk to the device using the Segger J-Link connection which is an outstanding feature.
To dump the trace data with GDB, I can use the following GDB command line:
dump binary memory <file> <hexStartAddr> <hexEndAddr>
As it is not easy calculate start and end address, I have added a new function
void RTOSTRC1_vGetGDBDumpCommand(byte *buf, word bufSize, byte *fileName);
in the Percepio Trace Processor Expert component
which generates the command line for me:
void RTOSTRC1_vGetGDBDumpCommand(byte *buf, word bufSize, byte *fileName) { &nbsp; /* construct gdb command string: dump binary memory &lt;file&gt; &lt;hexStartAddr&gt; &lt;hexEndAddr&gt; */ &nbsp; uint8_t *ptr; /* pointer to data */ &nbsp; size_t len; /* size/length of data */ &nbsp; ptr = (uint8_t*)RTOSTRC1_vTraceGetTraceBuffer(); &nbsp; len = RTOSTRC1_uiTraceGetTraceBufferSize(); &nbsp; UTIL1_strcpy(buf, bufSize, (unsigned char*)"dump binary memory "); &nbsp; UTIL1_strcat(buf, bufSize, fileName); &nbsp; UTIL1_strcat(buf, bufSize, (unsigned char*)" 0x"); &nbsp; UTIL1_strcatNum32Hex(buf, bufSize, (uint32_t)ptr); &nbsp; UTIL1_strcat(buf, bufSize, (unsigned char*)" 0x"); &nbsp; UTIL1_strcatNum32Hex(buf, bufSize, (uint32_t)(ptr+len)); }That way I can set a breakpoint in the Trace ‘full’ hook and copy the command line string:
Generated GDB Dump Command Line String
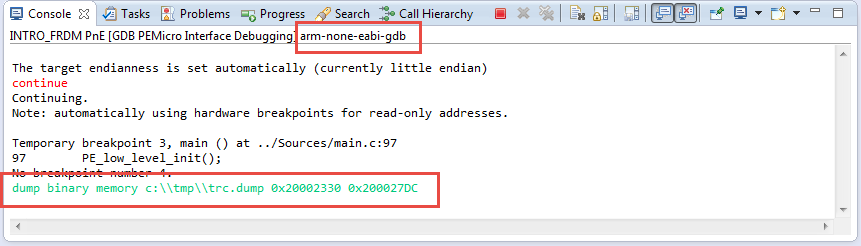
And then paste and use it in the arm-none-eabi-gdb console of Eclipse/GDB:
GDB Dump Command in GDB Console
Extra Trace API
Beside of the above function to generate the debugger trace dump command line string, there are several new functions exposed with the component interface. See the online help for details.
Extra Percepio API
FreeRTOS Configuration Define for Trace
To make it simpler in the application code to determine if FreeRTOS+Trace is enabled, the
configUSE_TRACE_HOOKSmacro can be used which is defined in FreeRTOSConfig.h
configUSE_TRACE_HOOKS
Summary
The version 2.7 runs successfully with my projects, and I really enjoy using it. There are as well tips & tricks from Percepio available. I have submitted a few source changes to Percepio which hopefully get integrated in the next version. I really like the new views, the ability to view and export the events as text files, and the new ability to trace the memory manager. The availability of such a great tool makes my decision to use FreeRTOS in nearly all projects even more compelling.
As always, I see a few things I have in my mind to improve in a future version of the Percepio Trace Processor Expert component:


- Having more trace items configurable to be disabled. This would allow to selectively trace certain events, making the trace duration longer.
- Support for tracing to a SD card for longer trace duration.
- Using the ARM cycle (DWT) counter to measure time (I think this does not exist on Cortex-M0+, but on M4).
The updated sources are on GitHub, so anyone using Git can use the new feature right away. Updated *.PEupd files with other added features will be released later this month on SourceForge.
Happy Tracing 🙂

That command line debugging trick is pretty top notch!
LikeLike
Pingback: McuOnEclipse Components: 03-Feb-2015 Release | MCU on Eclipse
Pingback: Tutorial: Using Processor Expert and FreeRTOS with Kinetis SDK V1.2 | MCU on Eclipse
Pingback: FreeRTOS Continuous Trace Streaming | MCU on Eclipse
HI Erich,
I was introduced to Percepio Tracealyzer at FTF2015 with you. I found this tool incredibly easy to use and very informative. However, I have a few existing MQX based projects that I would like to analyze in a similar fashion. Do you have any similar tools for MQX that you would recommend? Primarily, I am looking for the visualization of the time spend in my tasks and ISRs.
Thanks,
Tim
LikeLike
Hi Tim,
no, to my knowledge the trace from Percepio does not exist for MQX. What could be done is adding the trace hooks yourself to the MQX code, but that would be quite some work.
But MQX comes with task aware plugins (TAD) for Eclipse which can produce a lot of information too.
You can install the MQX plugins using the Eclipse ‘Install new Software’ way from http://nxp.com/lgfiles/updates/Eclipse/KDS
LikeLike
Pingback: First Steps with Ozone and the Segger J-Link Trace Pro | MCU on Eclipse
Pingback: RTOS Trace: TraceX with Microsoft Azure RTOS (aka ThreadX) | MCU on Eclipse