
The great thing with open source tools like Eclipse and GNU (gcc, gdb) is that there is a wealth of excellent tools: one thing I had in mind to explore for a while is how to generate code coverage of my embedded application. Yes, GNU and Eclipse comes with code profiling and code coverage tools, all for free! The only downside seems to be that these tools seems to be rarely used for embedded targets. Maybe that knowledge is not widely available? So here is my attempt to change this :-).
Or: How cool is it to see in Eclipse how many times a line in my sources has been executed?

Line Coverage in Eclipse
And best of all, it does not stop here….
The files/sources of this article are available on GitHub, both the older version (for ‘classic’ Eclipse) and for the NXP MCUXpresso IDE:
- Eclipse with Processor Expert: https://github.com/ErichStyger/mcuoneclipse/tree/master/Examples/Eclipse/FRDM-K64F/FRDM-K64F_Coverage
- MCUXpresso IDE with FreeRTOS: https://github.com/ErichStyger/mcuoneclipse/tree/master/Examples/MCUXpresso/FRDM-K64F/FRDM-K64F_gcov
- MCUXpresso IDE bare metal: https://github.com/ErichStyger/mcuoneclipse/tree/master/Examples/MCUXpresso/FRDM-K64F/FRDM-K64F_gcov_bm
The MCUXpresso projects are the most up-to-date version.
NOTE: if using an actual version of the GNU tools, there might be an issue preventing to collect code coverage as explained in this article. Be sure to read the comments section below and check out https://github.com/reeteshranjan/libgcov-embedded.

Coverage with Eclipse
To see how much percentage of my files and functions are covered?
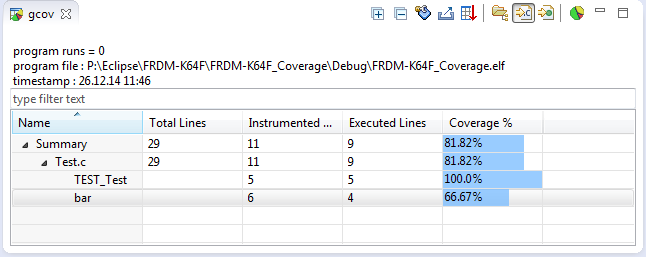
gcov in Eclipse
Or even to show the data with charts?

Coverage Bar Graph View
Outline
In this tutorial I’m using a Freescale FRDM-K64F board: this board has ARM Cortex-M4F on it, with 1 MByte FLASH and 256 KByte of RAM. The approach used in this tutorial can be used with any embedded target, as long there is enough RAM to store the coverage data on the target. I’m using Eclipse Kepler with the ARM Launchpad GNU tools (q3 2014 release), but with small modifications any Eclipse version or GNU toolchain could be used. To generate the Code Coverage information, I’m using gcov.

Freescale FRDM-K64F Board
Generating Code Coverage Information with gcov
gcov is an open source program which can generate code coverage information. It tells me how often each line of a program is executed. This is important for testing, as that way I can know which parts of my application actually has been executed by the testing procedures. Gcov can be used as well for profiling, but in this post I will use it to generate coverage information only.
The general flow to generate code coverage is:
- Instrument code: Compile the application files with a special option. This will add (hidden) code and hooks which records how many times a piece of code is executed.
- Generate Instrumentation Information: as part of the previous steps, the compiler generates basic block and line information. This information is stored on the host as *.gcno (Gnu Coverage Notes Object?) files.
- Run the application: While the application is running on the target, the instrumented code will record how many the lines or blocks in the application are executed. This information is stored on the target (in RAM).
- Dump the recorded information: At application exit (or at any time), the recorded information needs to be stored and sent to the host. By default gcov stores information in files. As a file system might not be alway available, other methods can be used (serial connection, USB, ftp, …) to send and store the information. In this tutorial I show how the debugger can be used for this. The information is stored as *.gcda (Gnu Coverage Data Analysis?) files.
- Generate the reports and visualize them with gcov.
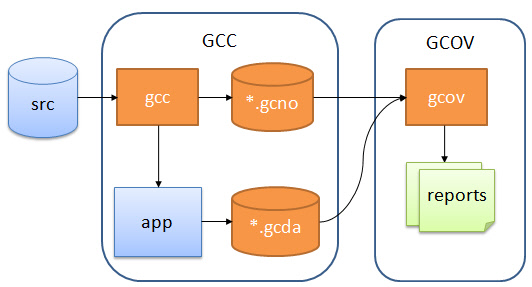
General gcov Flow
gcc does the instrumentation and provides the library for code coverage, while gcov is the utility to analyze the generated data.
Coverage: Compiler and Linker Options
To generate the *.gcno files, the following option has to be added for each file which should generate coverage information:
-fprofile-arcs -ftest-coverage
💡 There is as well the ‘–coverage’ option (which is a shortcut option) which can be used both for the compiler and linker. But I prefer the ‘full’ options so I know what is behind the options.
-fprofile-arcs Compiler Option
The option -fprofile-arcs adds code to the program flow to so execution of source code lines are counted. It does with instrumenting the program flow arcs. From https://gcc.gnu.org/onlinedocs/gcc/Debugging-Options.html:
-fprofile-arcs Add code so that program flow arcs are instrumented. During execution the program records how many times each branch and call is executed and how many times it is taken or returns. When the compiled program exits it saves this data to a file called auxname.gcda for each source file. The data may be used for profile-directed optimizations (-fbranch-probabilities), or for test coverage analysis (-ftest-coverage). Each object file’s auxname is generated from the name of the output file, if explicitly specified and it is not the final executable, otherwise it is the basename of the source file. In both cases any suffix is removed (e.g. foo.gcda for input file dir/foo.c, or dir/foo.gcda for output file specified as -o dir/foo.o). See Cross-profiling.
If you are not familiar with compiler technology or graph theory: An ‘Arc‘ (alternatively ‘edge’ or ‘branch’) is a directed link between a pair ‘Basic Blocks‘. A Basic is a sequence of code which has no branching in it (it is executed in a single sequence). For example if you have the following code:
k = 0;
if (i==10) {
  i += j;
  j++;
} else {
  foo();
}
bar();
Then this consists of the following four basic blocks:

Basic Blocks
The ‘Arcs’ are the directed edges (arrows) of the control flow. It is important to understand that not every line of the source gets instrumented, but only the arcs: This means that the instrumentation overhead (code size and data) depends how ‘complicated’ the program flow is, and not how many lines the source file has.
However, there is an important aspect to know about gcov: it provides ‘condition coverage‘ if a full expression evaluates to TRUE or FALSE. Consider the following case:
if (i==0 || j>>20) {
In other words: I get coverage how many times the ‘if’ has been executed, but *not* how many times ‘i==0’ or ‘j>=20’ (which would be ‘decision coverage‘, which is not provided here). See http://www.bullseye.com/coverage.html for all the details.
-ftest-coverage Compiler Option
The second option for the compiler is -ftest-coverage (from https://gcc.gnu.org/onlinedocs/gcc-3.4.5/gcc/Debugging-Options.html):
-ftest-coverage Produce a notes file that the gcov code-coverage utility (see gcov—a Test Coverage Program) can use to show program coverage. Each source file’s note file is called auxname.gcno. Refer to the -fprofile-arcs option above for a description of auxname and instructions on how to generate test coverage data. Coverage data will match the source files more closely, if you do not optimize.
So this option generates the *.gcno file for each source file I decided to instrument:

gcno file generated
This file is needed later to visualize the data with gcov. More about this later.
Adding Compiler Options
So with this knowledge, I need to add
-fprofile-arcs -ftest-coverage
as compiler option to every file I want to profile. It is not necessary profile the full application: to save ROM and RAM and resources, I can add this option only to the files needed. Actually as a starter, I recommend to instrument a single source file only at the beginning. For this I select the properties (context menu) of my file Test.c I add the options in ‘other compiler flags’:

Coverage Added to Compilation File
-fprofile-arcs Linker Option
Profiling not only needs a compiler option: I need to tell the linker that it needs to link with the profiler library. For this I add
-fprofile-arcs
to the linker options:

-fprofile-arcs Linker Option
Coverage Stubs
Depending on your library settings, you might now get a lot of unresolved symbol linker errors. This is because by default the profiling library assumes to write the profiling information to a file system. However, most embedded systems do *not* have a file system. To overcome this, I add a stubs for all the needed functions. I have them added with a file to my project (see a version of it on GitHub).
💡 In this code I’m using the UTIL1 (Utility) Processor Expert component, available on SourceForge. If you do not want/need this, you can remove the lines with UTIL1.

Coverage Stubs File in Project
Coverage Constructors
There is one important thing to mention: the coverage data structures need to be initialized, similar to constructors for C++. Depending on your startup code, this might *not* be done automatically. Check your linker .map file for some _GLOBAL__ symbols:
 .text._GLOBAL__sub_I_65535_0_TEST_Test
                0x0000395c       0x10 ./Sources/Test.o
Such a symbol should exist for every source file which has been instrumented with coverage information. These are functions which need to be called as part of the startup code. Set a breakpoint in your code at the given address to check if it gets called. If not, you need to call it yourself.
❗ Typically I use the linker option ‘-nostartfiles’), and I have my startup code. In that case, these constructors are not called by default, so I need to do myself. See http://stackoverflow.com/questions/6343348/global-constructor-call-not-in-init-array-section
In my linker file I have this:
  .init_array :
  {
    PROVIDE_HIDDEN (__init_array_start = .);
    KEEP (*(SORT(.init_array.*)))
    KEEP (*(.init_array*))
    PROVIDE_HIDDEN (__init_array_end = .);
  } > m_text
This means that there is a list of constructor function pointers put together between __init_array_start and __init_array_end. So all what I need is to iterate through this array and call the function pointers:
/* call the coverage initializers if not done by startup code */
void gcov_init(void) {
#if GCOV_DO_COVERAGE
  void (**p)(void);
  extern uint32_t __init_array_start, __init_array_end; /* linker   defined symbols, array of function pointers */
  uint32_t beg = (uint32_t)&__init_array_start;
  uint32_t end = (uint32_t)&__init_array_end;

  while(beg<end) {
    p = (void(**)(void))beg; /* get function pointer */
    (*p)(); /* call constructor */
    beg += sizeof(p); /* next pointer */

#endif /* GCOV_DO_COVERAGE */
}
So I need to call this function as one of the first things inside main().
Heap Management
The other aspect of the coverage library is the heap usage. At the time of dumping the data, it uses malloc() to allocate heap memory. As typically my applications do not use malloc(), I still need to provide a heap for the profiler. Therefore I provide a custom sbrk() implementation in my coverage_stubs.c:
void *_sbrk(int incr) {
  extern char __HeapLimit; /* Defined by the linker file */
  static char *heap_end = 0;
  char *prev_heap_end;
  char *stack;

  if (heap_end==0) {
    heap_end = &__HeapLimit;
  }
  prev_heap_end = heap_end;
  stack = (char*)get_stackpointer();

  if (heap_end+incr > stack) {
    _write (STDERR_FILENO, "Heap and stack collision\n", 25);
    errno = ENOMEM;
    return (void *)-1;
  }
  heap_end += incr;
  return (void *)prev_heap_end;
}
❗ It might be that several kBytes of heap are needed. So if you are running in a memory constraint system, be sure that you have enough RAM available.
The above implementation assumes that I have space between my heap end and the stack area.
❗ If your memory mapping/linker file is different, of course you will need to change that _sbrk() implementation.
Compiling and Building
Now the application should compile and link without errors.Check that the .gcno files are generated:
💡 You might need to refresh the folder in Eclipse.

.gcno files generated
In the next steps I’m showing how to get the coverage data as *.gcda files to the host using gdb.
Using Debugger to get the Coverage Data
The coverage data gets dumped when _exit() gets called by the application. Alternatively I could call gcov_exit() or __gcov_flush() any time. What it then does is
- Open the *.gcda file with _open() for every instrumented source file.
- Write the data to the file with _write().
So I can set a breakpoint in the debugger to both _open() and _write() and have all the data I need 🙂
With _open() I get the file name, and I store it in a global pointer so I can reference it in _write():
static const unsigned char *fileName; /* file name used for _open() */

int _open (const char *ptr, int mode) {
  (void)mode;
  fileName = (const unsigned char*)ptr; /* store file name for _write() */
  return 0; /* success */
}
In _write() I get a pointer to the data and the length of the data. Here I can dump the data to a file using the gdb command:
dump binary memory <file> <hexStartAddr> <hexEndAddr>
I could use a calculator to calculate the memory dump range, but it is much easier if I let the program generate the command line for gdb :-):
int _write(int file, char *ptr, int len) {
  static unsigned char gdb_cmd[128]; /* command line which can be used for gdb */
  (void)file;
  /* construct gdb command string */
  UTIL1_strcpy(gdb_cmd, sizeof(gdb_cmd), (unsigned char*)"dump binary memory ");
  UTIL1_strcat(gdb_cmd, sizeof(gdb_cmd), fileName);
  UTIL1_strcat(gdb_cmd, sizeof(gdb_cmd), (unsigned char*)" 0x");
  UTIL1_strcatNum32Hex(gdb_cmd, sizeof(gdb_cmd), (uint32_t)ptr);
  UTIL1_strcat(gdb_cmd, sizeof(gdb_cmd), (unsigned char*)" 0x");
  UTIL1_strcatNum32Hex(gdb_cmd, sizeof(gdb_cmd), (uint32_t)(ptr+len));
  return len; /* on success, return number of bytes written */
}
That way I can copy the string in the gdb debugger:

Generated GDB Memory Dump Command
That command gets pasted and executed in the gdb console:

gdb command line
After execution of the program, the *.gcda file gets created (refresh might be necessary to show it up):
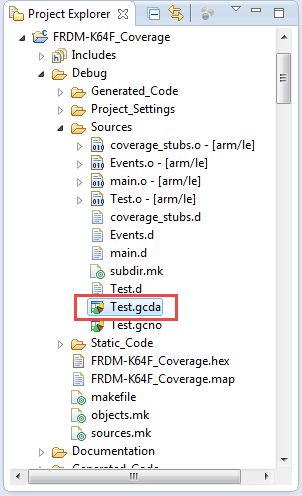
gcda file created
Repeat this for all instrumented files as necessary.
Showing Coverage Information
To show the coverage information, I need the *.gcda, the *.gcno plus the .elf file.
💡 Use Refresh if not all files are shown in the Project Explorer view

Files Ready to Show Coverage Information
Then double-click on the gcda file to show coverage results:
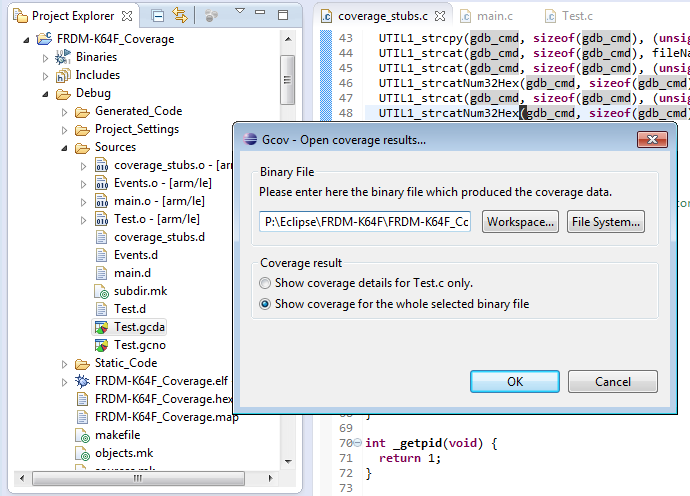
Double Click on gcda File
Press OK, and it opens the gcov view. Double click on file in that view to show the details:

gcov Views
Use the chart icon to create a chart view:

Chart view

Bar Graph View
Video of Steps to Create and Use Coverage
The following video summarizes the steps needed:
Data and Code Overhead
Instrumenting code to generate coverage information means that it is an intrusive method: it impacts the application execution speed, and needs extra RAM and ROM. How much heavily depends on the complexity of the control flow and on the number of arcs. Higher compiler optimizations would reduce the code size footprint, however optimizations are not recommended for coverage sessions, as this might make the job of the coverage much harder.
I made a quick comparison using my test application. I used the ‘size’ GNU command (see “Printing Code Size Information in Eclipse”).
Without coverage enabled, the application footprint is:
arm-none-eabi-size --format=berkeley "FRDM-K64F_Coverage.elf"
   text       data        bss        dec        hex    filename
   6360       1112       5248      12720       31b0    FRDM-K64F_Coverage.elf
With coverage enabled only for Test.c gave:
arm-none-eabi-size --format=berkeley "FRDM-K64F_Coverage.elf"
   text       data        bss        dec        hex    filename
  39564       2376       9640      51580       c97c    FRDM-K64F_Coverage.elf
Adding main.c to generate coverage gives:
arm-none-eabi-size --format=berkeley "FRDM-K64F_Coverage.elf"
   text       data        bss        dec        hex    filename
  39772       2468       9700      51940       cae4    FRDM-K64F_Coverage.elf
So indeed there is some initial add-up because of the coverage library, but afterwards adding more source files does not add up much.
Summary
It took me a while and reading many articles and papers to get code coverage implemented for an embedded target. Clearly, code coverage is easier if I have a file system and plenty of resources available. But I’m now able to retrieve coverage information from a rather small embedded system using the debugger to dump the data to the host. It is not practical for large sets of files, but at least a starting point :-).
I have committed my Eclipse Kepler/Launchpad project I used in this tutorial on GitHub.
Ideas I have in my mind:
- Instead using the debugger/gdb, use FatFS and SD card to store the data
- Exploring how to use profiling
- Combining multiple coverage runs
Happy Covering 🙂
Links:
- Blog article who helped me to explore gcov for embedded targets: http://simply-embedded.blogspot.ch/2013/08/code-coverage-introduction.html
- Paper about using gcov for Embedded Systems: http://sysrun.haifa.il.ibm.com/hrl/greps2007/papers/gcov-on-an-embedded-system.pdf
- Article about coverage options for GNU compiler and linker: bobah.net/d4d/tools/code-coverage-with-gcov
- How to call static constructor methods manually: http://stackoverflow.com/questions/6343348/global-constructor-call-not-in-init-array-section
- Article about using gcov with lcov: https://qiaomuf.wordpress.com/2011/05/26/use-gcov-and-lcov-to-know-your-test-coverage/
- Explanation of different coverage methods and terminology: http://www.bullseye.com/coverage.html

Great! I planned to add some profiling support to GNU ARM Eclipse for quite some time, your article might make things faster. 🙂
LikeLike
I was going to add a support request for code profiling, glad to see you already had that in mind 🙂
LikeLike
Hi Erich
A useful article on the important topic of code quality and testing. However, to me, this article is mostly about how to run the tool, and I think it would be valuable if you could write a companion piece at a higher level. Perhaps you could extend your example to explain: (1) How to test bar(), (2) why TEST_Test() will test bar(), (3) how to run TEST_Test() – your video shows it being run in a for(;;) loop, (3) why the code coverage tool provides insight into the quality of the code and the test coverage, and (4) provide an example of a bug or weakness that this process can reveal.
I don’t know whether you cover formal quality assurance methodology with your students? I do know that it is a real subject that must be addressed in even simple embedded systems, that they and your readers (like me!) will encounter frequently in the real world. For example, European and US regulators both mandate the use of IEC 62304 “Medical Device – Software Life Cycle Processes” which requires the design of a test process and the documenting of the results. It would be great if you could follow this article with others that cover GNU tools that can be used. A perfect article would take a real-world requirement of a standard and show a real-world GNU tool being used to address the requirement.
A serious related question is the extent to which PE code, including FRTOS, can be used in medical devices, and other safety-critical systems. Discuss!
Finally, a couple of good links:
http://www.emdt.co.uk/article/developing-medical-device-software-iso-62304
http://medicaldesign.com/prototyping/industry-viewpoint-device-makers-can-take-cots-only-clear-soup
Thanks as always for your invaluable articles. – Charles
LikeLike
Hi Charles,
yes, this article is about running the tools, not about the higher level motivation for coverage, tests and to meet any compliances (e.g. medical). I don’t cover that in my course because this is a very large topic on its own, and this topic is covered with other courses we offer at the university (we just have started a new department around medical technologies).
As for PE code, FRTOS and any other sources or libraries: of course they can be used in any kind of applications, but it depends on the given regulations. E.g. if the regulation says that only ADA can be used, then it will be hard to find a FreeRTOS written in ADA, or that certain things like inline assembly are not allowed. But for all these kind of things the usual solution is to deal with it as an exception, and carefully document and making things compliant.
Erich
LikeLike
Pingback: Code Coverage with gcov, launchpad tools and Eclipse Kinetis Design Studio V3.0.0 | MCU on Eclipse
Hi Erich
First of all great tutorial about gcov on embedded system for code coverage.
Before asking my questions to you I would like to inform you about my project details…
Myself currently working with LPC54102 microcontroller and target was to test entire peripheral APIs. That part is almost done and we put Jenkins as CI tools for testing incremental release of LPC54012 APIs lib. Now the remaining part is the code coverage for that we use gcov.
As we all know that *.gcda files are created inside target board and its always make BIG question mark!!! Your tutorial is the only way I just finding out over google. So, what I does at my end, port your entire coverage_stubs.c file and related changes in my project.
Now I suffered from linker errors(about start and end init_array) in my LPCXpresso IDE(modified eclipse). My knowledge is very limited about linker script and section called .init_array. What can I do and get context about *.gcda files back to host.
Thanks in advance 🙂
LikeLike
Hi Bhoomil,
thanks :-).
About your linker error: what is the exact error message? I think only what might be missing are some symbols to mark the end of the heap. Have a look here about a similar problem: https://mcuoneclipse.com/2015/05/30/problem-undefined-reference-to-__end__-if-using-semihosting/
I hope this helps,
Erich
LikeLike
Compiler Error message seems like this :-Undefined referance at __init_array_start, __init_array_end symbol. But I am already defined this two symbol inside linker script within .init_array section.
LikeLike
Something like this?
.init_array :
{
PROVIDE_HIDDEN (__init_array_start = .);
KEEP (*(SORT(.init_array.*)))
KEEP (*(.init_array*))
PROVIDE_HIDDEN (__init_array_end = .);
} > m_text
LikeLike
the other thought I have: you are not linking the proper libraries? These symbols are used with the standard libraries for the initialization code during the startup.
LikeLike
Actually In my LPC linker script there is no any section called .init_array but after viewing your code I came across static_init function and realized that it is necessary for me to copy that part in my code as well as .init_array section symbol addition in my LPC linker script. I am using Redlib(nohost) lib currently for building my code in LPCXpresso IDE. Do you think that I’m missing something in startup code??
LikeLike
Yes, I think you are missing something with/in the startup code. Gcov as I have used it depends on semihosting, so you need to configure your project that it is using/working with semihosting, including terminal and file I/O.
LikeLiked by 1 person
Hi Erich,
Great work!
I have a system that has FatFS, an SD card, threadx and codesourcery toolchain for ARM.
I have already added the -fprofile-arcs -ftest-coverage options and I see one .gcno file being generated. No warnings, errors or unresolved symbol linker errors are generated during the build.
Then, I load the binary to the SD card. Reset the system, it works as usual, but, I don’t see the .gcda files.
I’m guessing I have to add some coverage stubs to the mix. Is that correct? How would I go about doing that?
Thanks a lot,
Joe
LikeLike
Hi Joe,
Are you using an I/O library which is able to write to the SD card/FatFS? What you need is that fopen()/fwrite/etc are using the SD card and file system. This will not be the default (usually). So you need to ensure (or implement) that your standard I/O library is taking advantage of the SD card. I hope that makes sense?
LikeLike
I checked and fopen, fseek et al are available in the system. Could it just be I need to do the linker initialuzation of the counters?
Thanks
LikeLike
Hi Joe,
that the functions are there does not say anything. Depending on your library, they could be ’empty’ and not doing anyting. Are you sure you have a full semihosting implementation available?
LikeLike
Hi! Thanks for the post. I am working on getting coverage for a Raspberry Pi from Eclipse, following your guide. The thing is I get to the point where I get this error:
Error: selected processor does not support requested special purpose register — `mrs r0,msp’
make: *** [src/coverage_stubs.o] Error 1
Do you know how can I solve it? Or do you have any guidance for getting coverage for the RPi?
Thanks!
LikeLike
The Raspberry Pi is using a different ARM core. I used ARM-M4/M0+, while the Raspberry Pi is an ARM11. The assembly syntax is different, so you would need to change the assembly code to ARM11 assembly code.
LikeLike
Thanks! And where exactly do you define assembly instructions in your project?
LikeLike
Hi Oscar,
they are in the coverage stub (see as well the code in this article).
LikeLike
Got it. I think the error is because the instruction MRS is not supported on ARMv6. Do you know any similar instruction when moving the SP to r0?
LikeLike
Hi Eric,
it’s a very useful articles!
i am trying to use the TWRK64F120M to test the code coverage.
After i look into the articles, i have some questions:
1. how do you know the memory and the memory size to save the coverage data?
2. the *.gcda open and the gdb_cmd build are done manually? because i didn’t found the call flow of the _open() and _write().
LikeLike
Hi Meili,
first of, there is a newer this subject here: https://mcuoneclipse.com/2015/05/31/code-coverage-with-gcov-launchpad-tools-and-eclipse-kinetis-design-studio-v3-0-0/
That approach is still using a low level approach, but give you some insights how things are working internally.
Related to that, you might have a look at profiling here: https://mcuoneclipse.com/2015/08/23/tutorial-using-gnu-profiling-gprof-with-arm-cortex-m/
The above article is using semihosting. I belive I have done coverage with semihosting too, but not sure if I ever published an article about this, would have to check.
about your questions:
1) The size of memory is based on how many ‘arcs’ are present in the code. See the article about profiling. I usually do some trial-and-error size estimation.
2) the *.gcda files are created as part of the _exit() library call. _exit() will then call _open() and _write().
I hope this helps,
Erich
LikeLike
yes, i have looked into the article and the code in the Github in the link
i tried to use the code coverage without profiling (set option -ftest-coverage only).
in the coverage_stubs.c, i saw the exit() call the gcov_exit() as:
void gcov_exit(void);
void _exit(int status) {
(void) status;
gcov_exit();
for(;;){} /* does not return */
}
so from above code, i didn’t see the call flow of open() and write().
LikeLike
Hi Meili,
it is burried behind gcov_exit(). open() and write() will be called from the library. You can see this if you set a breakpoint on open() and write().
Erich
LikeLike
Hi Erich,
i tried the full option set -fprofile-arcs -ftest-coverage, the open/write will be called by gcov_exit. but if set the compiler option with -ftest-coverage, the open/write with never be called by gcov_exit().
LikeLike
Hi Meili,
did you check in the debugger if maybe the program is running into an assertion or crashes somewhere? It would be interesting to know where it goes after gcov_exit(). Beside of that: do you have semihosting turned on/enabled? If so, it will try to use the semihosting open/write. If you are using P&E semihosting: their fopen/fwrite is not implemented, so you would have to use the Segger semihosting.
LikeLike
HI Erich,
Thanks for the amazing article.
While I tried this with the libgcov.a from the arm toolchain path directly, I could n’t call gcov_exit() in my test application coz, the symbol was HIDDEN in libgcov.a.
How can I get over this?
LikeLike
Hi Benix,
Are you using the toolchain and libraries from ARM (launchpad) and GNU ARM Embedded?
that symbol should not be hidden (or static). I recommend you do not link directly with the libgcov library, but instead let the linker pick the correct libraries. Using the standard libraries directly will require deep knowledge of the linker internals.
I hope this helps,
Erich
LikeLike
Hi Samuel,
after furter investigation: it seems that this is an issue with GNU/gcc 5.x. It works fine with 4.8.4.
Erich
LikeLike
Hi Samuel,
see this for a solution https://answers.launchpad.net/gcc-arm-embedded/+question/286502. Can you try __gcov_flush()?
LikeLike
Hi Erich,
Yes, I was using the libgcov.a from ARM (launchpad) embedded toolchain.
Now, letting linker to find the correct library, gives the following error.
arm-none-eabi-ld: error: required section ‘.got’ not found in the linker script
arm-none-eabi-ld: final link failed: Invalid operation
But I see .got data put in .text section.
.text : {
_stext = ABSOLUTE(.);
KEEP(*(.text.startup))
*(.text .text.*)
*(.fixup)
*(.gnu.warning)
*(.rodata .rodata.*)
*(.gnu.linkonce.t.*)
*(.glue_7)
*(.glue_7t)
*(.got)
*(.gcc_except_table)
*(.gnu.linkonce.r.*)
_etext = ABSOLUTE(.);
} > SRAM
should I create a exclusive .got section as below. If so, will the following do?
.got : {
*(.got*)
} > SRAM
.rel.plt : {
*(.rel.plt*)
} > SRAM
Coz, adding above sections built the binary but it didn’t boot up.
LikeLike
Samuel,
that linker file looks strange. This is one I’m using:
https://github.com/ErichStyger/mcuoneclipse/tree/master/Examples/KDS/FRDM-K64F120M/FRDM-K64F_Coverage/Project_Settings/Linker_Files
I’m not using such a .got section.
Erich
LikeLike
Hi Erich,
I was trying to do on different Cortex-R chipset with GNU. I just realized that the comment sections are only for your content, I would stay away. Thanks !!
LikeLike
Hi Erich,
I followed all the steps and using the same test code on windows machine but I’m getting the value of gdb_cmd as :
dump binary memory D:\\code_coverage_test\\test1\\Debug/Sources/test.gcda 0x200030BB 0x200030BC
That is ONLY 1 byte and hence code coverage is 0%.
But interestingly, when I try the same code on Ubuntu Machine, I’m getting the desired code coverage.
Can you guide what the problem might be?
Thanks!
LikeLike
Hi Raja,
If using the newlib-nano (and not newlib), the library probably writes single bytes. Are you sure that on both machines you are using the same ARM standard libraries?
LikeLike
Hey Erich!
Thanks a lot! It worked. 🙂
LikeLike
Hey Erich!
Using newlib-nano library on my windows machine, I’m able to get more than one byte in buffer and I’m able to create gcda files for all my source code files but when I try opening the gcda file(s) in KDS, the code coverage is still 0%.
Could you please suggest how to solve this?
Thanks
Raja
LikeLike
Hi Raja,
have you tried to dump the coverage information with the commmand line tools already? It could be that this works, but shows zero in Eclipse if Eclipse cannot find the necessary tools?
I had to rename/copy GNU binary tools (see https://mcuoneclipse.com/2015/08/23/tutorial-using-gnu-profiling-gprof-with-arm-cortex-m/).
LikeLike
Hey Erich,
Thanks for the pointer. Earlier I had only renamed gcov and addr2line which didnt work but after renaming strings, c++filt and nm, I’m getting code coverage!
Thanks a lot for your help! 🙂
LikeLike
Erich,
Also on double clicking on file in that view, I’m unable to see the executed lines in green and not executed ones in red colors. I’ve checked the related settings in KDS, but still nothing works. Do you had to enable any other option or any other change?
LikeLike
Hi Raja,
either the code has not been executed at all?
Or that somehow Eclipse finds other GNU tools than the one matching the ones in KDS?
I did not had to set anything else in KDS, but I had to make sure that really all the correct binary tools were present.
Have you tried the command line tools to verify that coverage is indeed present in your data files? To single out problems in Eclipse.
LikeLike
Thanks for this post. Most of things worked fine except that with current version of gnu arm toolchain, which is 5-2016-q3-update as of now (https://launchpad.net/gcc-arm-embedded/5.0/5-2016-q3-update), the function __gcov_flush just hangs. It was used because gcov_exit is made static in this version.
I made a port of gcov_exit starting from the gcc source for this version, and on using this directly rather than calling the gcc library’s version, I found the bug that was causing the hang. Basically, there is one gcov_info struct node per source file, and at 3 places in the flow of gcov_exit/__gcov_flush a circular list of these nodes is accessed as a non-circular singly linked list! So basically the loop never ends causing the hang. My attempt of calling __gcov_flush got stuck at the 1st of these 3 hangs.
Not sure how such a big bug was introduced much later to this article being published and things working. I have published my port at https://github.com/reeteshranjan/libgcov-embedded for everybody’s use. You’ll definitely need this if you are in October/November 2016 or later till the bug in gcc code is fixed.
LikeLike
Many, many thanks for that information! This explains why one student reported to me that with the newer GNU toolchain coverage did not work. Now everything makes sense. Many thanks again for sharing!
LikeLike
Pingback: Code coverage using Eclipse, GNU ARM toolchain, and Gcov for embedded systems | Technical Info Articles
For those who are facing issues getting the coverage to work as of today, please see my comment above and Erich’s response. I ended up getting an approach that has a major difference of not using C library API stubs. I have documented my approach here: https://technfoblog.wordpress.com/2016/11/05/code-coverage-using-eclipse-gnu-arm-toolchain-and-gcov-for-embedded-systems/.
LikeLike
Hi Erich,
Thank you for the detailed step-by-step explanation of the procedure.
I am trying to get code coverage using your approach above.
But, I am a novice with these tools.
I have picked up a basic ‘HelloWorld’ project to start with, using the basic eclipse C based project template.
I have been able to generate the .gcno files but and I have multiple queries related to generation of .gcda files here:
1. Where is the coverage_stubs.h file that is included in the coverage_stubs.c
2. I have copied your ‘coverage_stubs.c’ as it is and tried to compile, after commenting the UTIL1 commands, but my project seems o have another definition of _write, _read, _exit and other functions defined in this file.
3. Do I need to install the GCOV plugin for Eclipse to be able to get the coverage? If yes, how?
4. Is the coverage doable If I use the Debug perspective, and not the real hardware?
I am really stuck here!
Thanks in advance,
Khushboo
LikeLike
Hi Khushboo,
1) Have a look at the project on GitHub (link at the end of the article): https://github.com/ErichStyger/mcuoneclipse/tree/master/Examples/Eclipse/FRDM-K64F/FRDM-K64F_Coverage/Sources
2) If using the standard way of writing the data with semihosting, you might overwrite these functions.
3) No, you can use the gcov command line tool (no need for the plugin). If you call gcov with the help option, it will list all the options. See https://gcc.gnu.org/onlinedocs/gcc/Invoking-Gcov.html
4) the debug perspective is only a set of views/windows in Eclipse. You will need real hardare to run coverage, unless you are using a simulator.
I hope this helps,
Erich
LikeLike
Hi Erich,
Thank you so much for the response. Yes that helps. I have been able to get the code coverage.
I would be really thankful if you could help me with this another question that I have.
I am trying to port some test scripts written in IBM RTRT (*.ptu scripts), to eclipse, and see if I can get the same coverage as was available through IBM RTRT scripts.
I need to understand if the features and the coverage reports provided by RTRT could be generated in eclipse as well?
I know this is out of the scope of this page, but, just in case you are aware or if you could point me to a relevant link, that would help.
Best Regards,
Khushboo
LikeLike
Hi Khushboo,
I don’t know that IBM RTRT, so I’m affraid that I cannot be of any help here 😦
LikeLike
Pingback: Adding GNU Coverage Tools to Eclipse | MCU on Eclipse
Pingback: GNU Code Coverage on Embedded Target with Eclipse Neon and ARM gcc 5 | MCU on Eclipse
Hey There! Thank you very much for this awesome tutorial!
I successfully used gcov on my STM32 to get some coverage analysis. Well, now I went on adding the FreeRTOS to my Project, so the call gcov_exit() (or gcov_flush()) is done within a FreeRTOS task. Unfortunately this ends in a System Hard Fault Exeption at the symbol _etext. Is there anybody out there having success in using gcov and FreeRTOS?
LikeLike
I usually end the scheduler and then to the coverage dump (outside of the scheduler). This requires that the FreeRTOS port supports vTaskEndScheduler().
If you want to dump the coverage information from a task, make sure you have plenty (!!!) of task stack space available. Start with 20 kByte or more.
I hope this helps,
Erich
PS: I have extracted the gcov libraries from the ARM libs. That way I can run gcov in a fine tuned way. I did not had the time to publish in an article yet.
LikeLike
Hey Erich, Thank you for your quick reply. Yes, I already tried to end the scheduler, but this is not supported for me. 😦
I already found out that gcov needs about 17kByte stack space for my little testProject. I increased the tasks stack space to about 60kbyte. Nevertheless I am running into this hard fault exception.
Instead of dumping the data with a debugger I am using some linker flags to link the fwrite routine (which is called by gcov_exit) against my own fwrite-function which then dumps the data out to the serial console. This works pretty fine without the scheduler.
May I should take a look to your fine tuned source code. Did you recompile the arm-toolchain? Did you publish your that code anywhere?
LikeLike
It is still work in progress, and things are available here:
https://github.com/ErichStyger/mcuoneclipse/tree/master/Examples/MCUXpresso/FRDM-K64F/FRDM-K64F_gcov
Maybe this helps you.
Otherwise, if time permits, I will post an article in the next days or so (no promise, I just will try)
LikeLike
Thank you for the link to the example. I took a look to the source code which opened up my mind. I think I understood now how gcov is working, correct me if I am wrong:
Your example seems to contain multiple custom implementations which can replace the libgcov.a which is used in this article above by passing the -lgcov flag to the linker. Your example decides which of these three implementations to use by using some macros in the gcov_write function.
In summary the custom implementations are providing a pointer of type struct gcov_info which holds the coverage data and the __gcov_init(struct gcov_info *info) function which is called by the instrumented code for every source file. The __gcov_ini fills the local gcov_info struct. So at the end of the program execution all coverage data is accessible by this struct. To dump the coverage data to the hosts file system the custom implementations seem to use different ways…
I think I will give it a try and do my own custom implementation…
PS: Is it faster to use the Serial USART (115200bits/s) and some grep commands or a scripted debugger to dump the serial data out to the file system? What do you think ?
LikeLike
Your analysis is correct. And using an UART will be very likely faster than semihosting as this involves a lot of stop-and-go for the debugger. But that depends on the debugger and semihosting implementation.
I hope this helps,
Erich
LikeLike
Yes, I really did it! After inspecting the different implementations from your link, I decided to create my own implementation based on the tcov implementation https://github.com/tejainece/tcov and the tiny-coverage implementation https://github.com/aitorvs/tiny-coverage. The result is now a very easy to use gcov version which replaces the official gcov library, so I do not need to compile with -lgcov. All gcda files are now printed out to the serial console with 115200kbit/s which is about 11kbyte/s payload. My implementation works fine within FreeRTOS and needs now less than 3kByte of stack space.
The output on the serial console is then converted by a little script (using some regular expression) to the gcda files.
Thank you very much!
If you are interested in my implementation for your new article?
LikeLike
That’s great news! If you could share your material, this would be really great!
Thanks a lot,
Erich
LikeLike
Hi Erich and eDeviser,
I am trying to do code coverage for frdm_k64f board but not using any IDE. I am facing few issues related to the linking itself. I have enabled the coverage flags as mentioned in the article and not added the change to include lgcov so that i can have my own custom gcov implementation. The issue i see, even without the lgcov my app builds without any issues but does not dump any data. Have you come across issue like this?
eDeviser, Can you share the GitHub link of your changes related UART?
LikeLike
The IDE really does not matter. It only matters if you want to use the IDE to view the data.
How do you dump your data? if using semihosting, make sure you are linking with the semihosting libraries. If the semihosting is not present or if you have ‘nosys’ variants, nothing will happen if gcov reads or writes data.
LikeLike
Hey Ramakrishna, thank you for your interest into my code. I’m going to publish my changes for you next week
LikeLike
Hi Erich,
I am seeing issues with building itself. I am using arm-gcc compiler for building and added the arcs and coverage CC flags. Then i added my own custom gcov_init and gcove_merge_add dummy functions with prints and compiled the application. Note: I have not linked lgcov as i wanted to use my own custom fuctions. Now the compilation is successful and my app got built. But if i run the load the app on frdm_k64f i don’t see my custom gcov functions being called as i do not see any prints.
If I look at the map file I see a lot of references to .__gcov0
P.S: Your reply did not give me an option to reply so I am replying to this comment.
LikeLike
I suggest you try to build and use it first with a working solution, and then later go on using your own setup, step by step.
That way you always have a base and previous step you can refer to.
I have a working example for the latest MCUXpresso IDE 10.2 on GitHub here: https://github.com/ErichStyger/mcuoneclipse/tree/master/Examples/MCUXpresso/FRDM-K64F/FRDM-K64F_gcov
I hope this helps,
Erich
LikeLike
yeah i think that would be better. Thanks a lot for your time.
LikeLike
So here we are. I pasted all code snippets to github. You can find it here:
https://github.com/eDeviser/lwgl
Meanwhile I automated the process of gaining the coverage data. Until now I run through more than fife thousand cycles with those routines at github. 🙂
LikeLike
Great! And thanks for sharing!
LikeLike
Hey there. I tried to update to gcc 7.3.1 the linker says: “libgcov-driver.c:(.text+0x1460): multiple definition of `__gcov_init'”.
I inspected the code in libgcov-driver.c but I cannot figure why __gcov_init is already defined…
LikeLike
I’m right now at gcc 7.2.1, not sure if it will report the same for me. But have you implemented __gcov_init() in your own code? Or did you tell the linker to link with the gcov libs?
LikeLike
Well the compiler says, that __gcov_init us once implemented by my own implementation (https://github.com/eDeviser/lwgl/blob/master/coverage.c) and that there is a second implementation in libgcov.a which is part of the arm toolchain.
And as I told you, I did NOT compile with -lgcov.
LikeLike
Not sure what the issue is. But I can say it works fine for me with the MCUXpresso IDE and its GNU toolchain/libraries.
You can find the example project on https://github.com/ErichStyger/mcuoneclipse/tree/master/Examples/MCUXpresso/FRDM-K64F/FRDM-K64F_gcov
I hope this helps,
Erich
LikeLike
I’m using sucessfully the GNU Tools for Arm Embedded Processors 7 – Q2 2018 release (MCUXpresso IDE 10.3.0) and don’t see that issue, maybe you can give it a try?
I have my project on github: https://github.com/ErichStyger/mcuoneclipse/tree/master/Examples/MCUXpresso/FRDM-K64F/FRDM-K64F_gcov
LikeLike
Hello eDeviser, hello Erich!
How did you get rid of the problem with “multiple definition of `__gcov_init'” ?
I could not solve it with the Linker-settings, it only compiled, whe I commented out the `__gcov_init’-function in your coverage.c, but of course, then I dont get any data at all.
…I am trying this with you LWGL-code on STMCubeIDE and an F4-Discovery-Board.
Thanks, Florian Hinterleitner
LikeLiked by 1 person
Hi Florian,
On my side, I did not face the problem with multiple definition of __gcov_init(), using the GNU ARM compiler/libraries.
Can you check the linker map file from where your __gcov_init() is coming from? What I would do if it links with a library one: rename the one in coverage.c and call it from your main() before doing any coverage data collection. The idea is to overwrite the one from the library that way.
I hope this helps.
LikeLike
Hello Erich,
Thank you for your great Articles.
Shouldn´t it be possible to use Segger´s RTT to get the data out of the Controller ?
Kind regards
Uwe
LikeLike
Yes, absolutely. I have started on such a solution (not finished/published yet). The problem is that gcoc is using file I/O which is not natively supported by RTT (unlike semihosting). So what I did is taking out the gcov library from the GNU library and changing it as such that it can use any kind of connection. I have it working from the point to dump the coverage information, but not to the point that it will open and append the data to the coverage data from a previous run. So still some work to do ….
LikeLike
Wohoo! 😦 I just ran put of memory! Looks like the init_arrays need so much space that there is not enough memory left for the stack during runtime. Looks Like I am having too much code.
LikeLike
yes, gcov needs more memory the more modules are covered. What I do is running multiple test runs with different parts covered if there is not enough memory on the target. I started on a project to have the coverage tables on the host to reduce the needed amount of memory on the target, but I have not finished that one due lack of time.
LikeLike
Sounds nice. But my coverage is being procuded during a long term test which takes multiple hours. I think this is the very end of whats possible with this hardware.
LikeLike
Yes, that does not make it easier. If you need twice as much RAM compared to what you have, you would have to run the tests twice with only one or the other half instrumented.
LikeLike
“However, most file systems do *not* have a file system”.
My embedded device even has a file system which has a network of embedded devices as the backend each filing a list of file systems in no time.
LikeLike
So you are very lucky with probably not much cost constraints? In that case, you simply can use the normal file I/O functions and get gcov going.
LikeLike
Thank you for this great article and detailed instructions.
I am trying to follow your article to generate code coverage information for my project. I am using STM32G431, and I built the project using STM32CubeIDE (version 1.3.1), which comes with arm-none-eabi-gcc (version 7.3.1).
I followed the instructions on https://mcuoneclipse.com/2017/06/18/adding-gnu-coverage-tools-to-eclipse/ to install GNU gcov tool (version 7.4).
I added the compiler options, and the .gcno file is generated. For the coverage stubs, many of the defined functions were already existing in my syscalls.c file (e.g., int _fstat, int _close, int _open), but I replaced them with the code you provided in coverage_stubs.c since most of the functions in syscalls.c were just returning -1. I only kept _sbrk as is since the one in coverage_stubs.c was returning “undefined reference to `__HeapLimit.”
While debugging, I set a breakpoint on __gcov_flush() (used instead of gcov_exit()), but the code hangs and never returns.
I am not sure what I have done wrong, I have a minimum experience in code coverage, so I highly appreciate it if you can help me figure this out.
LikeLike
Hi Lama,
first: thanks! 🙂
About your question: keep in mind that transmitting data with Semihosting can be slow, especially if you have a slow debug probe.
Try to instrument only a single file with few functions to limit the data to see if it works.
If it ‘hangs’: check with the debugger where this is. Might be difficult if it is in assembly code only, but try to understand the pice of code it is doing.
Last but not least: make sure you provide plenty of heap space: the more the better. Best if you provide initially 64 KByte or more.
LikeLike
Thank you for your response. Unfortunately, i wasn’t aware of the need for a debug probe to achieve code coverage on a micro controller as it is not mentioned in that article.
Having a regular serial connection via usb port won’t work?
Coverage is entering in an infinite loop it seems in the function crc32_unsigned.
Any inputs on what could cause that loop?
LikeLike
You need some way to get the data to the host. gcov uses file I/O by default, and a logical way is to use semihosting and for this you need semi-hosting capable debug probe like a P&E or SEGGER. This debug probe can be on-board too.
Or you can rewrite part of the gcov library and store data say on a SD card on the system, then you don’t need a debug probe.
Technically you could use a serial connection, but a) you will need to change the gcov stubs and b) you need a write a tool on the host to store the serial data in a file format gcov accepts.
Using a debug probe is the far best solution with the least effort.
Have you already increased the heap to say 30 KByte? Make sure you have plenty of stack space allocated too.
LikeLike
Hey there! I once created an implementation to transfer the gcov files via an serial interface to a host machine. Checkout my source code here: https://github.com/eDeviser/lwgl
LikeLiked by 1 person
Excellent, thanks for sharing it on GitHub!
LikeLiked by 1 person
Pingback: Tutorial: GNU Coverage with MCUXpresso IDE | MCU on Eclipse
I am using STM32 with eclipse ide. After adding gcov flags and loading the build toolchain and arm toolchain, I have done. Build is successful. While trying to debug when I debug the hex file, I am getting the error “Cannot load libraries.”. Could you please check and tell me how to resolve the problem.
LikeLike
Are you using the GNU ARM Embedded libraries from ARM (this is what you should)?
LikeLike
Hello Erich!
thanks for your advise on renaming ‘gcov_init()’, that did the trick.
Now i am tweaking an ITM-channel to transmit the binary-data, which is also a challenge, but progress is thre 🙂
Sorry for answering on the wrong post, but your reply to my mesage has no ‘reply’ button
greetings, Flo
LikeLiked by 1 person
When using gcov, after build I am able to successfully generate .gcno file. During execution I am able to debug through the program. But I am getting the error “Invalid character ‘\’ in expression.” when I put a breakpoint in close function Debugger Console and .gcda file is not getting generated. So code coverage output cannot be seen.
Could you please check and tell what could be the problem.
LikeLiked by 1 person
Are you using my example project? Did you check with the debugger where it is hanging? Depending on your compiler version (and library) it might be that there is an endless loop in the data structure (known bug, but I think not fixed yet in the library).
LikeLike
I am getting the below error also in debugger console.
Breakpoint 1, _close (file=) at ../../../coverage_stubs.c:105
105 gdata_len = 0;
Invalid character ‘\’ in expression.
LikeLike
again: are you using that example project I have provided?
and: have you removed/deleted all breakpoints/watchpoints? It looks like you are using an illegal expression with it.
LikeLike
No I am using a different project. I am using MCU GCC compiler and MCU GCC Linker.
No, I have added a breakpoint in close function in coverage_stubs.c to confirm that it is hitting the close and generating the gcov information.
LikeLike
Not sure what you mean with ‘MCU GCC’ compiler and linker. I assume you mean the GNU ARM Embedded?
I recommend that you try my setup and example as this is a know working configuration. I don’t know what is different in your setup otherwise.
Same for your message about the breakpoint: if you are using something different, I don’t know how I would be able to help you?
LikeLike
Brilliant Article Erich…
I am going to have a go with an STM32H7 (ARM Cortex M7)… getting the runtime data out over USART at runtime… I’m also using cmocka to help with embedded unit testing… This *should* give a fully open source solution that gives 100% statement coverage via unit test…. all running on target, Excellent! I am also hoping to get QEMU to emulate the processor too… So then I don’t even need any physical hardware… Very good for open source collaboration.
Thanks.
Paul.
LikeLiked by 1 person
Hi Paul,
thank you :-).
Yes, coverage is helpful for my applications too where I have enough RAM and ROM for the extra instrumentation. I have been somewhat skeptical to simulation solutions: I prefer to run the tests on the real thing if possible.
Erich
LikeLike
Ok, I have it all building and running on target… given it loads more heap allocation and am calling a particular function using cmocka to run the unit test. Then I am calling __gcov_flush() once the unit tests have completed.
I’ve configured the _write() function to use UART output instead of a file… I can see that the gcov code is writing something to the serial port…. I get the following:
profiling:C:/Users/Paul/Documents/MercurySSUARTDevUnitTest/STM32UnitTestTemplate/Debug/OSSAT_Code/OSSAT-Platform-Demo/STM32GPIO_STM32GeneralPurposeInputOutput.gcda:Skip
And nothing else… it might be that the other data that would normally go into a gcda file is binary and therefore I’m having issues seeing it through a UART connection to a program like TeraTerm? However, the “Skip” makes me think that something else is the problem….
What issues lead to the gcov skipping over files? I am pretty sure I am calling functions in this file… I can see my cmocka results.
LikeLike
Ok, I’ve debugged the target and the call to __gcov_flush() only prints what I am seeing… no extra binary data… So I think it is Skipping the file which has data I want to see coverage results for 😦
LikeLike
Aha…
I’ve figured it out… The STMCube IDE comes with some stub code for _open() _close() etc. and this code was returning -1 all the time….
So I think that gcov was attempting to open the gcda file and the _open() function was returning -1… Then gcov throws an error.
Now I can see binary data coming out over the serial link which is presumably my lovely gdca file data (that I now need to store somehow :S)
LikeLiked by 1 person
Ah, I see: again the Semihosting stubs 😦 Glad to hear you have found it out, congratulations!
LikeLike
Hii,
i am facing this issue..my controller size is only 4kb..is there any solution to reduce size from coverage size?
region `RAM’ overflowed by 2984 bytes key_UTF
key_UTF.elf section `.bss’ will not fit in region `RAM’
Thanks,
Sri Divya
LikeLiked by 1 person
4 KByte is really on the lower end, you will not be able to do much useful. What you could do (if not already done) is instrumenting only one file and then have the results combined.
LikeLike
Pingback: Tutorial: GNU gcov Coverage with the NXP i.MX RT1064 | MCU on Eclipse
Hii,
I am trying to implement code coverage on st32f4 discovery board.
facing following errors loaded on target board.
src/main.gcda GCOV_ERROR_FILE GCOV_PREFIX_STRIPGCOV_PREFIX profiling:%s:Version mismatch – expected %.4s got %.4s
profiling:%s:Merge mismatch for summary.
profiling:%s:Data file mismatch – some data files may have been concurrently updated without locking support
r+bw+bprofiling:%s:Skip
profiling:%s:Cannot open
cannot allocate counter mismatch profiling:%s:Function %u %s %u
corrupted profile info: summary histogram index is corrupt corrupted profile info: summary histogram bitvector is corrupt Overflow Error function profiling:%s:Merge mismatch for %s %u
profiling:%s:%s merging
profiling:%s:Overflow writing
profiling:%s:Error writing
profiling:%s:Not a gcov data file
What will be the issues?
LikeLiked by 1 person
Hey Shawn… 2 things to try….
– Are you def running gcov using the gcno files (compile time) and gcda files (run time) from the same compilation i.e. you arnt using gcno files from a previous build of the code?
– Are you using the version of gcov that comes with stm32cube? i.e. the one that relates to the gcc cross compiler you are using (i.e. not another non-cross compiler version)?
LikeLiked by 1 person
Hi Shawn,
a few things to try/check:
– make sure you make a ‘clean’, then build your project to produce the correct .gcno files
– work with a minimal project, with just one simple test file instrumented
– coverage writing needs a lot of stack and heap space: provide as much memory for it as you can. Otherwise you might see the result of corrupted files because of a stack overflow
– use a J-Link as a connection: STLink and others are usually not reliable enough
I hope this helps,
Erich
LikeLike
Hi, this is very interesting article, unfortunately it seeme, that formatting is broken. i inspected the code, and there ase several nested
Hi marun,
yes, WordPress is a constant pain with embedded source code: it always screws up pages with source code :-(. Thanks for reporting. I edited the page again, and now it looks ok for me. Can you check?
Thanks!
LikeLike
Hi, it looks ok now, thanks
LikeLike