
I think the biggest frustration point for any new or even seasoned engineer is the debugging phase: my application finally builds fine, but I’m not able to connect and download it to the target board :-(. In my view the debugging part is the most fragile part of the development process. I’m always very relieved if I can connect to a brand new board, because I know if it does not work, then the problem could be a very bad one, costing my several hours or even days to overcome it.

Remote Communication Error, what now?
I don’t say that this is a complete check list, but I hope it will help you in a desperate situation where you are not able to connect or debug your target.
Check List
Below is my list to check things if debugging fails, based on my experience.
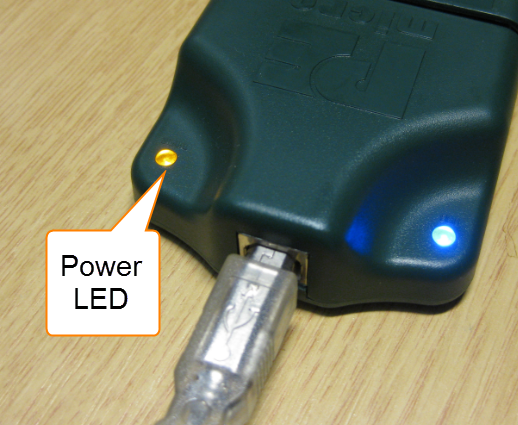
- Check power supply. Too many times the board is not powered, or the power supply not turned on. Or worse, that the external power supply is not stable or cannot provide the needed current. I had a case where the external power supply dropped the voltage every minute or so which dramatic consequences to the board. If your board is USB powered:make sure enough power is provided. Some notebooks are only providing 100 mA, use a powered hub or a 5V USB wall power supply. The P&E Multilink and other debug probes feature a ‘power sensing’ LED which helps in such a situation.

Power LED on P&E Multilink
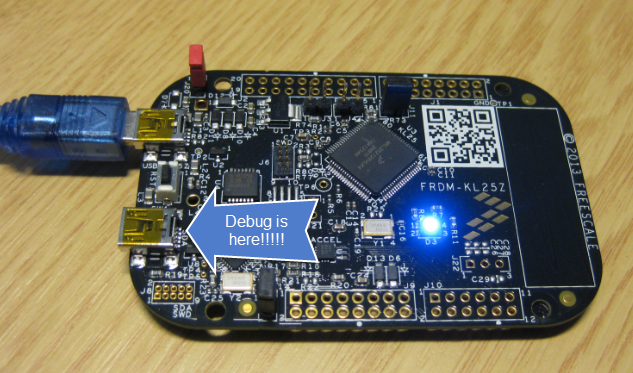
- Check the plug: on the Freescale Freedom boards there are two USB ports, but only one is for debugging:

Wrong USB Port
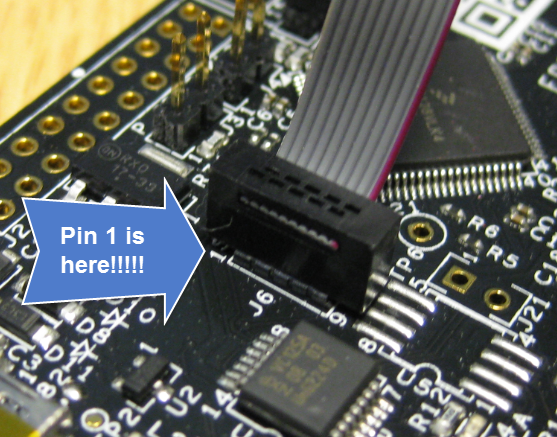
- Check the polarity of your debug cable: many debug headers/connectors do not protect you from putting the cable the wrong way.

Wrong Cable Orientation
- Change the USB cable and port. I have seen cases where one port on a host was somehow bad. Try avoid USB3 ports, do not use USB hubs between the host and the probe. Change cables and port. Avoid long cables. Check the USB contacts/plug on both the host and the probe side: they could be wear out, have bad contacts or even broken soldered connectors.
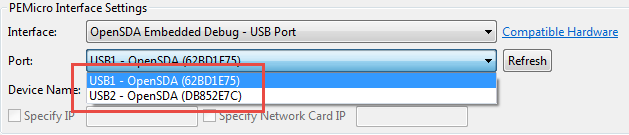
- Make sure you are talking to the right device. If you have multiple boards and multiple debug devices: Make sure you are connecting with the correct one. make sure your debugging device is listed. Most debug cable have USB ID: I put stickers with the number on the debug device.

Multiple Debug Devices Connected
- Check that you have a file: If you get a dialog telling you that the program file does not exist:

Program File Does not Exist
Then it exactly means that: the program file does not exist (:-)), or you have specified none or a non-existing file. Check your debug/launch configuration and have a valid file specified:

No Program File in Launch Configuration
- Update the firmware of board/debug probe: I have spent several times debugging a problem, only to find out that a new firmware of the board/debug probe solves the problem. In rare cases, a new firmware might break something working, so keep backups of the old firmware, just in case. See “Illustrated Step-by-Step Instructions: Updating the Freescale Freedom Board Firmware” how to update the Freedom board firmware.
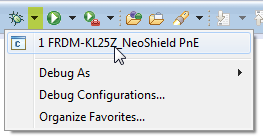
- Do not use the ‘debug’ icon: There is a bug in Eclipse Kepler+CDT that pressing the ‘debug’ button does not launch the right configuration, or screws up otherwise.

Debug As Button
Instead, select the debug/launch configuration from the drop down list:

Debugging from drop down list
If you do not have anything in the list, select the ‘Debug Configurations…’ entry and press ‘Debug’ from there. Use the ‘favorites’ menu setting to force it to the list:

Display in favorites menu
- Kill hanging debuggers. Check in the task manager if you have a zombie debug process (gdb executable, or whatever debugger technology you are using, see “Killing Me Softly: Zombies and Debugger Engines“).
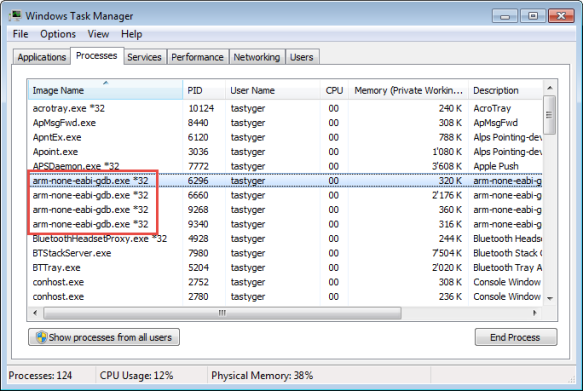
gdb Zombies!!!!
Kill them in the task manager. Or quit the IDE. If this does not help: restart your machine as last resort. Asking for trouble with gdb is if you try to launch a second debug session with one already going on.
Error in final launch sequence
Failed to execute MI command:
-target-select remote 127.0.0.1:7224

Error message from debugger back end:
Remote communication error.  Target disconnected.: No error.
Remote communication error.  Target disconnected.: No error.
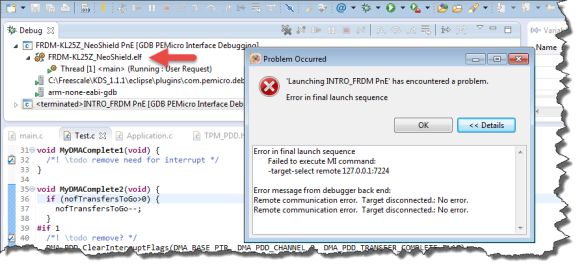
Trying to debug twice
Kill/Terminate first the current debug session before starting a new one.
- Verify the host drivers. USB drivers are a constant source of pain. Make sure you know which USB drivers should be active/present in your system. Note down your current configuration, because maybe you get a host machine update or whatever, and your drivers do not work any more. See “Fixing the USB Drivers“. If you have USB 3.0 plugs on your machine, switch to USB 2.0 ones, as for me USB 3.0 is a constant source of troubles.
- Check the cables. I had too many times bad USB cables, try to exchange the cables. In one case the USB plug in the notebook was worn out, try different USB ports. I had as well bad debugging flat cables: if they are used too long or bended too much, the cable can break inside, causing all kind of weird problems. Check as well the USB plug of the debug probe (cold solder on the connectors, maybe as bad as in “How NOT to Solder Headers on a Board“? Resoldering the connectors helped me in one case). I have seen a person complaining about debugging not working, and I noticed that the USB cable was maybe 5 or 6 meters long (yikes!). In another case we had frequent debugging failures, and the reason was noise from a nearby motor which affected the signals in the debug probe and cable: shielding the cables and probe plus shortening the flat band cable solved the problem. In any case: have your critical equipment duplicated: it is easier to swap out a part in the chain than just guessing if your debug probe is broken or not. I had bad debug probes probably broken by ESD (Electro-Static-Discharge) or other high voltage: having a second unit at hand will be a huge time saver.
- Check SWD or JTAG. Many ARM controllers can be used with SWD or JTAG (see “Using the FRDM-K64F with CodeWarrior“). If your board only has SWD, and I you get for example:
Connecting to target.
OpenSDA detected - Flash Version 1.14
Can not enter background mode.
Unable to initialize PEDebug.
PE-ERROR: Failed to Initialize Target
Then you try to connect in JTAG mode to the board, instead of SWD. Make sure you have the correct settings in your debugger:
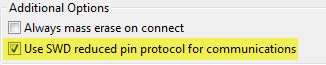
SWD Debugging Option Set
- Check the processor: Failing to set the correct processor in the debugger settings will let the debugger talk to a completely different CPU (different flash programming algorithm, different memory map, etc) and things are failing badly. It is easy to select the wrong device from the list. Every single letter or digit counts.

Many Devices
Check carefully what is soldered on the board: maybe the schematics is wrong, or you have a similar (but different) board. I had a case where the wrong microcontroller had been populated by the factory!
- Check the clocks. On ARM cores, you need to ‘clock’ any peripherals before you can access it, or you get a hard fault. Make sure that you clock for example the RTC before you access it. You might even need to power your peripheral externally with a dedicated pin first. Try first to run your microcontroller with the internal clock, at default and low-speed. Check the circuit of your external clock, check the data sheet of your oscillator/crystal if you have used the correct bypass capacitance network. Keep in mind that the external clock traces need to be as close to the processor as possible, and that it can influence other traces. I had a case where the debug traces were routed underneath the oscillator. Of course this was a great failing point :-(.
- Check the Watchdog: some devices have the watchdog enabled by default. If the watchdog does not get kicked, it will reset your processor. Ensure that the watchdog is disabled very early in the startup (right after reset).
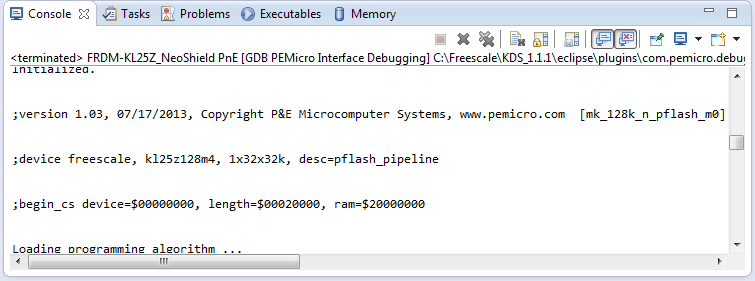
- Check the logs. Carefully inspect the debugger logs or console output. Does it make sense? Are the expected parameters listed? What is the debugger doing, and when does it fail?

Debugger Console Log
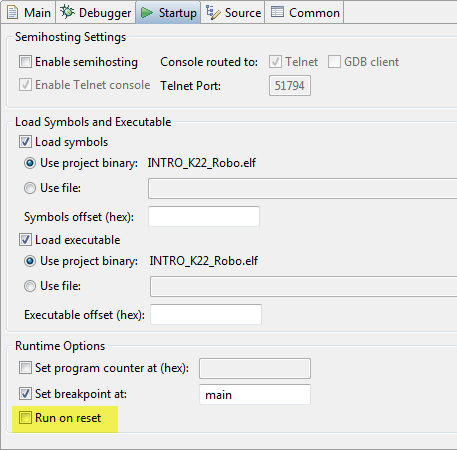
- Step through the startup code. If you are able to connect, but somehow the application does not reach main, you will need to debug through your startup code. Your debugger setting should have something like ‘run to main’ or ‘run after reset’: disable it so you can find out what is going on.

Running after Reset Disabled
- Check the debug pins: if you made your own board, are the signals/footprint correct? Reset line stable and as recommended by the vendor (usually pull-up with a capacitor)? Use as scope to inspect the signals. Check if there are not shortcuts between the signal lines. The debug probe needs the reset line to halt the processor: if the pull-up is too strong or the C too high, it might be difficult for the debugger to gain access. I had one case were the CPU was soldered (QFN package) wrongly :-(.
- Check if you have not disabled debugging: Have you secured your part (see “How (not) to Secure my Microcontroller“)? If it is secured, debugging is not possible, so hopefully you can still do a mass erase (see “Unlocking and Erasing FLASH with Segger J-Link“). With modern microcontroller it is possible to divert debugging pins for general purpose functions. Check if you have not disabled in your application critical resources for debugging (reset pin? JTAG/SWD pins?). Some processors have extra ‘firmware upgrade pins’, like the EzPort on Kinetis/ColdFire: wiring these pins wrongly will get the processor in a special/upload mode which interfere with debugging.
- Re-Muxed Debug Pins: On many controllers it is possible to re-use the pins used for debugging for other things like GPIO. Out of reset typically they are configured for debug, but if your startup or initialization code changes them to be used for something else than debugging, your debugging session will terminate.
- Divide and conquer: Try to get a working solution/project (e.g. use a simple/empty project with an evaluation board from your vendor). Then find out what is different in your non-working environment. Try to limit the number of variables: remove external/not needed connections on the board. I had a case where the external clock circuit was causing problem: removing that clock moved me on the right track.
- Keep an audit trail: Use a version control system for your project(s). Many times it works for a long time, and then you make a (you think unrelated) change, and things do not work anymore. Using version control system like Git allows you to go back in time, or make a diff what you have changed. It helps you as well for when the tool has corrupted you some of the settings.
- Try different tools/machines: Hopefully you have the choice of alternative tools. As sad as it is, depending on your system/drivers/other tools installed, one or the other tool might simply not work. Try installing your tools on a fresh machine to see if that helps. Use a different operating system (32bit/64bit, different windows version, etc), try it with your home machine. Maybe it works on one machine so you can isolate the problem.
- Re-power board and/or debug probe: sometimes the board and/or the debug probe are screwed up. Try re-power them. Sometimes the debug probe cannot force the target into reset mode (the debug probe constantly tries to pull the reset pin): power off the target microcontroller and re-power it might get the debug probe a chance to connect. If you have a reset button (you always should add one in your own design!), press the reset button while power-on the board to keep it hopefully in reset.
- Smell the blue smoke. Electronics are driven by blue smoke. Because when you see it coming out, you know it is dead. If you smell something weird, check if it is your board. Check the temperature of you microcontroller carefully touching it (I have burnt once one of my fingers badly!). If it is hot, turn off power and hope for the best (or a replacement).
- FreeRTOS Task Stacks: if using FreeRTOS, using very large stacks (say >4KByte) can cause problems with the debug probe kernel awareness: disable that kernel awareness and try a smaller stack if this makes a difference.
- Virus scanner and firewalls: Most debug probes use TCP/IP or other network based protocols to communicate. If that network traffic is blocked by firewalls, strange error messages will be the result. Turn off or suspend virus scanners and firewalls to see if this has an impact.
- Installation: Maybe some files are corrupted or missing? Uninstalling and re-installing things is usually something I do as a last resort, but sometimes it really helps. Make a fresh install (never (never!) try to ‘over-install’ (installing it over an already existing installation)
- Virtual Box? It seems that sometimes the Oracle Virtual Box network drivers can interfere with the debug probes which are using TCP/IP too, or making it really slow. Try to disable virtual box, or install it without the network drivers.
- GDB non-stop mode? Modern GDB offers a non-stopping mode (to read from the target while it is running). It seemst that could cause problems e.g. with the SEGGER J-Link (see discussion in Remote Debugging with USB based JTAG/SWD Debug Probes). Try disabling GDB Non-Stop mode:

non-stop-mode
- Windows Update: Check if there are any pending Windows updates. Especially if there is a failing socket or network connection like the one below:
java.net.SocketException: Connection reset
It seems that even if they are just pending they can have an impact and the ‘pending’ state disabled some networking functionality (because of vulnerabilities?). So make sure you update your machine and have it rebooted.


Summary
There is not a single tip or trick if debugging does not work. But checking the basics for shure will help. Otherwise, try to swap out things to limit the search area. The most troublesome things are custom boards, as many things can fail. Invest into an evaluation board which works so you have something to compare with.
Happy Debugging 🙂
PS: If you have more tips and tricks, post a comment and share!

> Do not use the ‘debug’ icon: There is a bug in Eclipse Kepler+CDT that pressing the ‘debug’ button does not launch the right configuration, or screws up otherwise.
Actually this is not a bug, but a feature with an unfortunate default. 😦
To change it:
– go to the Eclipse menu Preferences… → Run/Debug → Launching
– select Always launch the previously launched application in the Launch Operation section.
There is a also a preference string that can be defined in the product initialisation file, to start with the expected setting.
LikeLike
Hi Liviu,
thank you for that trick! Now indeed, that works much better 🙂
Now I only need to finid that preference string so it applies to all my workspaces (or new ones, at least).
Erich
LikeLike
as “usual” another great article! Thank you Erich! I just had to deal with exactly this kind of problem a few weeks ago. New board, no debug connection could be established… viewed signals with the scope, soldered caps to the SWD lines (which was quite fiddly), compared to former project, checked debug settings, changed adapters… until finally after about 2 days I found out, that copying the project and modifying it a little, I swapped SWD clock and Data-IO lines on the processor… and once again I had to remember one of my lecturers always saying: “Don’t ‘copy-paste’, it’s going to cause you problems!” … however, he did it himself anyhow… 🙂
LikeLike
:-). Oh yes, such a ‘copy-paste’ trap is well known to me too…. What I see very often is that a schematic gets copied from a reference board, but e.g. using a different external quartz, without checking the data sheet of that quartz. If you are not lucky, your clock circuit will not work.
LikeLike
Great list.
Thank you.
I would like to just add one simple point:
Check MCU temperature. If it is too hot that you cannot touch it for more than 2 seconds, you MCU is probably damaged by ESD or some shortcuts. Disconnect power supply as soon as possible.
LikeLike
That’s a good one! I have burnt once one of my finger with a bad microcontroller :-). I have added it to the list, thank you!
LikeLike
One trick I use to sort out problems when the code dies is adding a last_line variable
// last line goes in the no init section of ram which does not get cleared on startup
uint32_t last_line __attribute__ ((section (“.noinit”)));
// At least you can tell the code got here
last_line = __LINE__;
The other thing I’ve done is trap the fault interrupt and pull the calling address off the stack. Bonus when the calling address is 0 it means your code called a null function pointer. You can then grab the return address instead.
Then use arm-none-eabi-addr2line.exe to find the offending line number. As last night my code crashed, and the fault address was 1ccf
>arm-none-eabi-addr2line -e demo_main.elf 1ccf
C:\long path deleted\button_hand.c:188
LikeLike
Great tip! I think you could extend that with the __FILE__ macro, as otherwise you only know the line number, but not which source file.
LikeLike
Here’s a puzzle for the experts: I’ve been developing with the FRDM-KL05Z and yesterday took delivery of my first 8 target boards. These all programmed the first time with a Segger J-Link, via Kepler, but when I returned to re-program them with a new image, the programming mostly fails. The console says “Connecting to target…ERROR:Could not connect to target”. The scope shows no obvious problems with the SWD_DIO, SWD_CLK or /RST signals, or power. Changing J-Link clock speed has no effect.
My programmer cable assembly has a button that holds /RST to GND. I find if I hold the button low for “just the right amount of time” after I press the debug button then the programming works OK.
If I include for (;;) {//do nothing} on the line before PE_low_level_init(); there is no problem with programming, but if is on the line after the problem exists. A trivial program (flash an LED) does not have the problem. Are my PE components stopping J-Link from working?
Why?
LikeLike
Does your application disable/turn of the reset line (or maps it to a GPIO)?
Another thing to check: delete all breakpoints/watchpoints you might have, because GDB up to q3_2014 has a problem with this (see https://mcuoneclipse.com/2014/10/11/failed-to-debug-with-gdb-breakpoints-or-expressions-on-non-existing-locations/).
Can you check the circuit of the reset line? I had issues if the capacitance on the line is too high, or the pull-up is too strong.
You might check the cable of your segger J-Link too (or replace it if you have another one).
I hope this helps,
Erich
LikeLike
Thanks Erich.
I am not doing anything with the /RST line. I was programming SWD-DIO to be an output, so naturally I suspected that, but the problem is still there if I disable that functionality. On all lines the external circuitry is only 100k p.u. resistors. I have no breakpoints. Only one J-Link, but it has been reliable on other projects.
Remember – the fault depends on the firmware that was previously programmed, not the hardware. I am trying to think… could it be related to power consumption, or is there some chip configuration that could disable the SWD interface? Crystal startup time (i use a 32kHz xtal)? The thing that puzzles me is that I would expect the J-Link would take 100% control of the chip, before any software got to run. And what about me pushing the /RST button? Surely J-Link does that (indeed, I see two 120ms pulses on the scope) and does not need me to assert it? Interestingly, when it works I see me holding /RSTlow, but not the two J-Link /RST pulses, which suggests that perhaps J-Link asserts /RST too soon, or not for long enough??? (32kHz xtal again????)
I guess I could work through my application, removing one PE component at a time, towards the (working) trivial application, to see at what point the problem goes away, but I don’t have the time… It is a real effect, with a reliable work-around, and I must move on…
Regards – Charles
LikeLike
Nice list. Sysinternal’s “pskill” comes handy for killing zombies. It kill’s ’em all at once 🙂
LikeLike
I had a firmware image that remapped GPIO pins needed for the debugger. I got a “Can not enter background mode.” error when loading the debugger. I fixed it by enabling the “Always mass erase on connect” check box in Debug Configurations (Debugger tab).
LikeLiked by 1 person
Thanks for sharing that great tip!
LikeLike
Nice List ! But unfortunately, I can’t make my FRDM-K64F works with my brand new Pe Micro Universal Multilink ! I followed every single step of your post with no success. I still have the same error :
Connection from “127.0.0.1” via 127.0.0.1
PE-ERROR: Target is not connected
Disconnected from “127.0.0.1” via 127.0.0.1
Target Disconnected.
The Yellow LED of the debugger is ON when I put power on the FRDM-K64F.
I choose the K64FN1M0M12 microcontroller
I checked the “Use SWD protocol”
I have a good *.elf file (the same that is working with the OPENSDA debugger)
I see the Red LED (for the reset) of the FRDM-K64F lights up few ms when I try to communicate with the board.
The FRDM-K64F is brand new too and is working the factory application just well.
I tried to cut the J11 jumper to isolate the communication with the probe
I power the board with the SDA USB
I only have I debugger application open…. I tried the restart the computer
Can you help me with this problem ?
Regards,
Vincent
LikeLike
See https://mcuoneclipse.com/2015/05/11/debugging-the-frdm-k64f-with-pe-multilink/. Power the board with the K64F USB cable and leave all jumpers in the default position.
LikeLike
Thank you for your help
LikeLike
Pingback: GDB Client and Server: Unlocking GDB | MCU on Eclipse
Pingback: Board Bring-Up Tips, GDB Logs and Traces in Eclipse | MCU on Eclipse
Pingback: Troubleshooting Tips: Failed Debugging with GDB | MCU on Eclipse
Pingback: “java.net.SocketException: Connection reset”: Check your Windows Updates! | MCU on Eclipse