This is the third part of a tutorial series how to ‘do-it-yourself’ a tool chain for the Freescale Kinetis microcontroller, with the FRDM-KL25Z as example. The tool chain is using GNU ARM gcc plus Eclipse Kepler release. So far I have the following parts:
List of Tutorials
- Part 1: Setting up ARM GNU tool chain
- Part 2: Setting up Eclipse IDE
- Part 3: Setting up the debugger (P&E and Segger)
- Part 4: Setting up Processor Expert
- Part 5: Setting up FreeRTOS Kernel Awareness
- Part 6: Linux Host Support with OpenOCD and CMSIS-DAP
- Part 7: GNU ARM Eclipse Plugins
- Part 8: Processor Expert with GNU ARM Eclipse Plugins
- Part 9: DIY Free Toolchain for Kinetis: Part 9 – Express Setup in 8 Steps
- Part 10 – Project Creation with GNU ARM Eclipse 2.1.1
So far things are very generic. But with debugging it means different hardware, and different hardware connections. And for this connection we need a GDB Server.
GDB Server
Eclipse CDT features a GNU Debugger (GDB), and this is what I want to use here: debugging my microcontroller with GDB inside Eclipse. In order to debug the microcontroller, I need two other things: a GDB Server and a Debug Probe.

GDB with GDB Server
- The ‘Debug Probe‘ is a hardware/software able to talk to the microcontroller, e.g. using JTAG, SWD, or using e.g. a serial protocol to talk to a special program on the microcontroller. This Debug Probe stops the target, does single stepping, and in many cases does as well flash programming. Typical examples are the P&E Multilinks, Segger J-Link, or as well the OpenSDA Debug Firmware on the FRDM boards.
- The ‘GDB Server‘ is a service or program which sits between the GDB inside Eclipse and the Debug Probe. GDB talks to the GDB server using TCP/IP and a port number, so that GDB Server can be either on your host machine, or on a remote machine. It translates and sends commands from the GDB in Eclipse to the Debug probe, things like setting breakpoints and so on. The communication between the GDB Server and the Debug Probe depends on the probe capabilities. It can be USB, TCP/IP, Serial or anything else.
I need a matching GDB Server to my Debug Probe used. There are many possible, and in this post I show:
- P&E GDB Server: for P&E OpenSDA and P&E Multilinks
- Segger GDB Server: for Segger OpenSDA and Segger J-Link
💡 I’m aware that CodeRed has a GDB server too which works with their OpenSDA implementation (see this post). However, CodeRed has been acquired by NXP back in May 2013, and they will stop support for non-NXP parts. If you want to try it out, the steps below should work with minor modifications too.
But the list does not stop here. There are other especially open source implementation of GDB Servers (mbed? USBDM? OpenOCD with CMSIS-DAP?). I wanted to show in this post OpenOCD, but run into some setup problems. So I plan to cover OpenOCD in one of the next tutorials.
In order to add GDB debugging to my DIY Tool Chain, I need
- Add ‘GDB Hardware Debugging’ to Eclipse
- Add a GDB Server
- Configure the Eclipse Launch Configuration to talk with the GDB Server
Eclipse and GDB Hardware Debugging
Eclipse comes with a lot of plugins already installed. But what is missing is the ability to debug a board like the FRDM-KL25Z. For this we need to install ‘GDB Hardware Debugging‘. I do this with “install new software”:
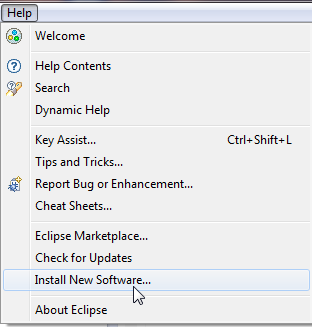
Install New Software
Then press ‘Add’:

Add new Site
Provide a name and point to
http://download.eclipse.org/tools/cdt/releases/kepler
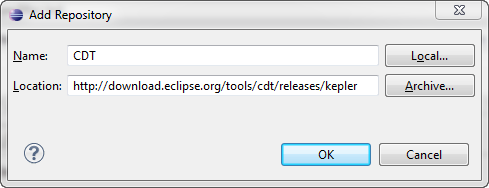
Kepler CDT Update Site
💡 If you are not using Kepler, then you will need to change the URL to point to the update site of the Eclipse release you are using.
Then select C/C++ GDB Hardware Debugging:

GDB Hardware Debugging Selected
The rest is trivial: click next and through the details of installing the software. At the end, restart Eclipse.
P&E GDB Server
❗ After publication of this article, P&E has released a new Eclipse plugin which includes a much better intergration and includes as well the GDB server (free of charge). So instead following the steps below, please have a look at P&E Eclipse Update Site for GNU ARM Eclipse Plugins.
P&E offers a GDB server for Kinetis devices. There is free (basic, limited) version available, and an unlimited (paid) one.

PnE GDB Server
Pros:
- Works for all P&E run control devices (Multilinks, including P&E OpenSDA on the Freedom and Tower boards.
- Free (limited speed and code size) version available. Not clear what the code size limit really is (one information says ‘half of the flash size’, and in the software itself I see ’64 KByte’ (although I’m using a 128 KByte KL25Z, so that might be the same).
- Used with the P&E OpenSDA, it supports USB CDC virtual COM communication.
Cons:
- Only Windows.
- Only for P&E firmware.
- Slow stepping and code size limitation in free version.
- Full version costs $299.
P&E GDB Server Configuration
Download and install the software from here. Make sure your target and debug connection has power.The FRDM-KL25Z needs to run the P&E OpenSDA Debug Application.
Start the server from the shortcut installed:
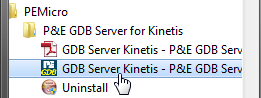
Starting P&E GDB Server
Use the refresh button to scan for a port on a given connection. Additionally, as the FRDM-KL25Z is using SWD, make sure that this option is selected, together with the selection of the device used:

P&E GDB Server Configuration
Once connected with GDB in Eclipse (see later), you should see some status messages on the right hand side:

P&E GDB Server Connected to Target
Segger GDB Server
Segger offers a GDB server for their J-Link debugging units on http://www.segger.com/jlink-gdb-server.html.
Segger J-Link GDB Server
Pros:
- Support for all Segger J-Link run control devices. Segger has an OpenSDA J-Link Lite implementation for the FRDM-KL25Z.
- Fast stepping and no code size limitation.
- ‘Unlimited‘ flash breakpoints.
- GUI and command line version for Windows.
- Linux and Mac support (command line version only).
Cons:
- No USB CDC with the FRDM-KL25Z board with the Segger OpenSDA firmware.
- Only for Segger firmware.
- Using it with Segger OpenSDA is subject of restrictions.
Segger GDB Server Configuration
Download the Segger GDB Server from here. Make sure your FRDM board has the Segger J-Link OpenSDA debug firmware loaded.
Start the J-Link Server. On my machine it is located in
C:\Program Files (x86)\SEGGER\JLinkARM_V472\JLinkGDBServer.exe
Configure it for SWD and the target device used:
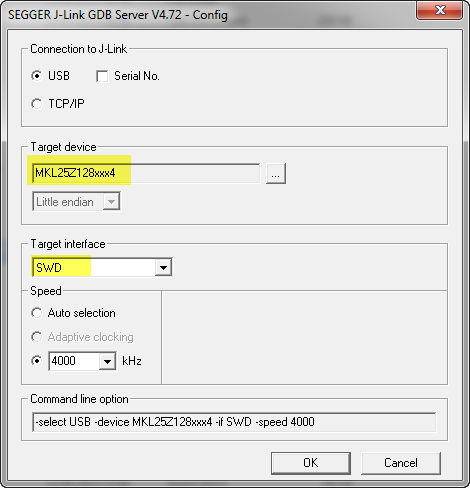
Segger J-Link GDB Server Config
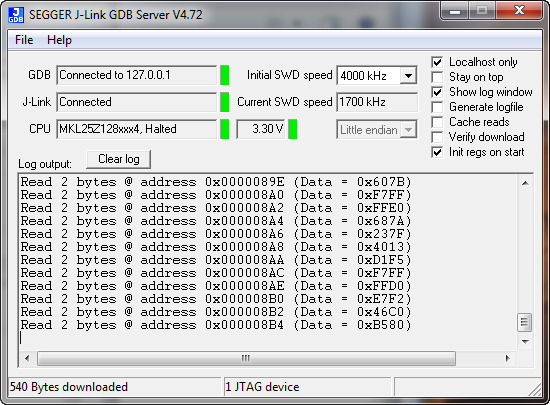
Pressing OK, and it should be waiting for the connection from Eclipse GDB:

J-Link GDB Server Waitng for Connection
Eclipse Debug Configuration
Eclipse needs to have a Debug Configuration for the project to be debugged. For this I select the project in the Project Explorer, and use the ‘Debug Configurations…’ menu under the ‘debug icon’ in the tool bar:

Debug Configurations
Then select ‘GDB Hardware Debugging’ and use the ‘+’ icon to add a new configuration:

New Launch Configuration
This populates the launch configuration with the project name and binary file to debug. I need to set it up to use the correct GDB. For this is choose ‘Select other…’:

Select other GDB
In the next dialog I select the Standard GDB Hardware Debugging Launcher:
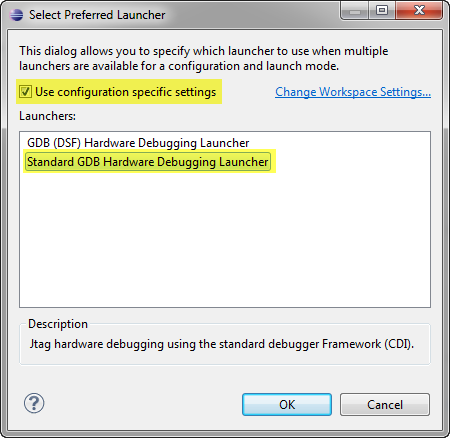
Standard GDB Hardware Debugging Launcher
In the Debugger tab, point to the GDB executable within the ARM GNU installation folder which is this for me:
C:\Program Files (x86)\GNU Tools ARM Embedded\4.7 2013q2\bin\arm-none-eabi-gdb.exe

GDB Debugger Settings
Startup Tab
In the Startup tab I can specify what should happen on starting the application. Basically I can initialize registers or set breakpoints:

GDB Startup Commands
❗ Somehow ‘#’ is accepted in gdb init scripts for comment lines, but not in above Eclipse dialog. So if you see errors in the console view about this, my only solution is to remove the lines starting with #
The first edit box has first commands sent to the gdb server. Below is the script I’m using for P&E:
# connect to the gdb server
# Ports used: P&E: 7224, Segger: 2331
target remote localhost:7224
# Set gdb server to little endian
monitor endian LITTLE
# Set JTAG speed to 1000 kHz
monitor speed 1000
# Reset the target
monitor reset 0
monitor sleep 100
# Set JTAG speed in khz
monitor speed auto
The above script is very simple and should work with most GDB servers. What is different for each server is the port. Segger is listening on a different port (2331), so use for the first command this:
target remote localhost:2331
I have ‘Set break point at:’ specified with ‘main’: that way the debugger stops at this address. Alternatively I can use the ‘break’ command in the ‘Run Commands’ area. In my setup I’m using this:
tbreak main
monitor reset 0
continue
which will start execution of the target.
💡 Use the GDB Server manual/reference to find out which other commands are supported.
Debugging
With everything set up, I can start the debugger:

Starting Debugger
and I’m debugging with GDB :-):

Debugging FRDM-KL25Z with GDB Debugger
Summary
In order to debug my microcontroller with GDB, I need a GDB server which works for my debug probe or debug connection. For the FRDM-KL25Z I can use the P&E GDB Server or the Segger GDB Server. The P&E one is free in a limited version only (limited code size, slower speed), while the Segger one is faster and unlimited, but does not offer USB CDC.
And I need to find out what it takes to have OpenOCD working too. Maybe somebody has written a tutorial about this already?
Happy Debugging 🙂

Thank you again for the tutorial. Unfortunatelly my week is bussy (developping electronics) and i have only time to look on this in detail except at the weekend, so I cannot provide instand feedback. Sorry.
I would prefer an fully open debugging tool. Unfortunatelly, I do not know how a solution. So I am very glad that you provide here a good learning resource.
I know it may be challenging, but I think it is required to have open tools make the board/chip popular. Honestly I am playing around with the Freesdom, but i am not yet advanced enough, that I could suggest it for a product. In my eyes the hardware features are excellent, but dokumentation (or my knowlhedge including resources) are too little. Freescales compiler/IDE really annoyed me and I am really used with GCC: For future products I would like to switch to MKL Series, because it has excellent hardware features. I would like to use that product for Power DC/DC Converters.)
One thing i would like to propose an idea for an tutorial: (it may be very challenging): How about a tutorial how to use the Freescale USB where you show how to switch the LEDs by USB using only open tools. And a talkback of the sliderposition by usb…
Thank you already for your work…
LikeLike
Hi Michael,
good to hear that things are useful, thanks! About your request: if you talk as well about open source USB libraries, then things get little complicated. The only good open source stack I know is the LUFA written by Dean Camera (http://www.fourwalledcubicle.com/LUFA.php). NXP has ported it for their devices. What I would need are volunteers who are willing to spend time and ressources in a joint project to port it to the Freescale USB. Anyone?
LikeLike
I’ve been working on a free software USB stack for use with the MC HCK. I’d love to get feedback. Look at the sources at . They are part of the MC HCK project, .
LikeLike
Hi Simon,
congratulations for your MC HCK project! Did you wanted to provide a link in your comment? I’m aware of the LUFA (http://www.fourwalledcubicle.com/) project, so maybe your project is based on this one, or is it differnt?
LikeLike
Yes, I tried to leave a link, but wordpress ate it. What I meant to write is:
I’ve been working on a free software USB stack for use with the MC HCK. I’d love to get feedback. Look at the sources at https://github.com/mchck/mchck/tree/master/toolchain/lib/usb . They are part of the MC HCK project, http://mchck.org .
All sources for the MC HCK are written from scratch, with good software and operating system design principles in mind. In my experience, LUFA was awkward to use, both for defining descriptors and for sending and receiving data.
LikeLike
Thanks for that link. I have not used LUFA actively, and I have not found it that awkward. I value the broad LUFA usage, and the many USB classes it supports. Starting things from scratch is always a good learning experience too.
But where I see a problem is that this USB stack is using GPLv3, without an exception in section 7. Unlike LUFA, this will not allow to combine your stack with non-GPL code as a ‘combined’ work. So is this very strict GPLv3 version intentional, or can it be changed to a LGPLv3 one?
LikeLike
I have not made my mind up yet. Probably it would get more use as LGPL.
LikeLike
At least for myself I would not be able to use it if it would be GPL (and not LGPL): it is not feasible to use (and learn/maintain) two USB stacks, one for the open projects and one for the research or development projects which are not going to be released to the public for multiple reasons. So a permissible license would definitely make usage and adoption of the stack more popular.
LikeLike
GPL and LGPL only require you to provide access to the source code to your licensees, i.e. entities who you provide with (products with) your compiled code. If you never give the binary to somebody, you do not have to share your code.
But that’s exactly the reason for using GPL or LGPL: Users need to have access to the sources, or they will not be able to customize it.
LikeLike
Yes, both GPL and LGPL requires access to the source code covered by it (say the USB stack). That’s not the problem. The problem is with ‘combined’ work. If you link/combine GPL code with non-GPL code, then the no GPL part gets ‘infected’ by the GPL. Say I would use your stack, and using customer (non-GPL) code/library. In order to make this work, the GPL license nees to have an exception in section 7 of your GPLv3 licensing terms.
See http://www.gnu.org/licenses/gpl-faq.html#GPLIncompatibleLibs
LikeLike
Pingback: DIY Free Toolchain for Kinetis: Part 1 – GNU ARM Build Tools | MCU on Eclipse
Pingback: DIY Free Toolchain for Kinetis: Part 2 – Eclipse IDE | MCU on Eclipse
Hi Erich, this is just awesome tutorial. I am now facing a problem with semihosting using Segger GDB Server. The GDB server crashes every time printf() to semihosting console is performed. I use GDB initialization commands as in your example, I just added line which enables semihosting (monitor semihosting enable). Do you have any experience with GDB server and semihosting? It would be a great upgrade of your awesome tutorial.
LikeLike
Hi Pepe,
I’m not using semi-hosting at all, for many good reasons, and your case is just yet another one :-(. So I’m sorry, I cannot help on this one.
LikeLike
There were some bugs related to semihosting in the SEGGER GDB Server, fixed in recent versions.
Semihosting trace messages can be routed over the stdout or the dedicated debug channel. The first one is a line buffered device, meaning it displays messages when the ‘n’ is encountered. If you want to display a partial string (for example ‘Connecting…’ and after a while ‘done’), you just need to insert a fflush(stdout) to make the first part visible. It works pretty well.
Another advice is to issue trace messages only on the Debug version of the application, since trying to write on the semihosting channel without the debugger connected and running is not silently ignored, but usually halts the application.
A much better solution (for ARM cores that support it) is to use the ITM/SWO debug channel. It is really fast, it does not hang when the debugger is not connected (Release configurations) and over this channel can be obtained more useful information, like watching data changes, watching interrupts enter/exits, etc.
My advice is to retry using semihosting with the new J-Link GDB server. If you need to see an working example, all the STM32Fx applications generated by the GNU ARM Eclipse Templates have functional debugging support and, even if you do not use STM32 processors, the code still can be useful.
LikeLike
Reblogged this on Sutoprise Avenue, A SutoCom Source.
LikeLike
The USBDM has been tested for Kinetis KL25Z http://sourceforge.net/projects/usbdm/files/Version%204.10.4/Installation/USBDM_Linux_V4.10.4.tar.gz/download I am personally going to test this very soon, I am all Linux 🙂
LikeLike
Hi Karibe,
yes, I have seen this, but not able to try it out. Let us know of the outcome.
Thanks!
LikeLike
I have been using USBDM in Linux, more stable than openOCD in my opinion and autoprobe works very well. 2014/03/usbdm-arm-debug-server-for-freescale-micro-controllers-in-linux-with-gnu-debugger/
LikeLike
Not sure, but is there a USBDM port for Mac OS X?
LikeLike
HI! Just one small question do you know how to add an easy way to restart the debug section with a simple button?
LikeLike
Good question! CodeWarrior has that functionality and has such a restart button, but I have not found this functionality in stock Eclipse. There are many such things I have seen so far, and they are smaller, but very convenient to use. I miss for example to right click on a folder and do ‘explore to here’ so I know where it is on my disk. Or to import projects with drag&drop. That’s the value of additional ease-of-use which exists in distributions from vendors like Freescale, but are not present in the ‘community’ version
LikeLike
I think this is a kind of “custom plug-in”… I know a way by the command line that is to type : monitor reset and after continue but it’s very awfull thing to do 😦 I also have tried to run a kind of “gdb script” that can run multiple commands but with no joy also 😦 I use segger tools for debug Zylin CDT for the gdb bridge because I have original segger j-link and the kwikstick that have an integrated j-link I already searched all over the net for this solution but still no joy 😦
LikeLike
Pingback: DIY Free Toolchain for Kinetis: Part 4 – Processor Expert for Eclipse | MCU on Eclipse
Pingback: DIY Free Toolchain for Kinetis: Part 5 – FreeRTOS Eclipse Kernel Awareness with GDB | MCU on Eclipse
Pingback: Setting up Linux opensource build and debug tools for freescale freedom board FRDM-KL25Z
arm-none-eabi-gdb gives me errors:
> monitor endian little
invalid command name “monitor”
LikeLike
Yes, I noticed this too. Looks like the syntax is
monitor endian LITTLE
then there is no error.
I need to update my post on this, so thanks for pointing this out.
LikeLike
actually at that point it should be ‘set’
(gdb) show endian
The target endianness is set automatically (currently little endian)
(gdb) set endian little
The target is assumed to be little endian
I am currently running gdb in termial 😉 till i figure out all the commands that work, also reading http://www.chemie.fu-berlin.de/chemnet/use/info/gdb/gdb_6.html
LikeLike
Pingback: DIY Free Toolchain for Kinetis: Part 6 – Linux Host with OpenOCD and CMSIS-DAP | MCU on Eclipse
I was able to follow these instructions to configure Kepler to hardware debug the KL25Z with the gdbserver included with CoFlash (from the CooCox folks) using the CMSIS-DAP firmware on the KL25Z. It works, but the experience isn’t the most desirable because flashing the program and some basic debug functions aren’t integrated into the Eclipse GUI.
A basic function that is missing is the ability to reset the MCU from the GUI — probably the same restart feature MAT asks about above. Is there an easy way to add such things? Or does one have to hack the CDT and GDB Hardware plug-in classes to enable such features?
I’m interested in the gdbserver with CoFlash because it’s one of the only free solutions I’ve found that can talk to some Nuvoton NuVoice chips I’m working with via the proprietary Nu-Link debug adapter. With some coaxing, I can get CooCox to support the NuVoice chips (it isn’t built in), but I would really like to move towards more open and free tools and away from the $3K Keil solution.
LikeLike
Hi Mike,
Yes, that’s the downside of these open and free solutions that they seem to handle the debugging poorly. I was looking into the reset and restart thing, and indeed GDB seems not to support this, and this was a surprise to me. Restart (re-downloading the program) is not a big deal to me, as not used very often, and this can be easily emulated with stopping the debug session and then debug again. But not having reset is a big hole in my view. There are two aspects of reset: performing a reset with the reset pin (hardware reset) would need support through the run control unit (e.g. OpenSDA), as this involves toggling the hardware reset pin. What is used most is a ‘software reset’, and this should be easily possible: setting the program counter to the start address of the application. All what I have found for this are GDB scripts/commands to do this. Thinks like ‘monitor reset’ (if supported), see http://embdev.net/topic/129593.
LikeLike
I looked at the CDT source code thinking it couldn’t be too hard to add additional GDB commands to the user interface. That was a mistake on my part. It’s scores of Java classes that look nearly indecipherable to me. I would like to add a button similar to the “step in” and “step over” buttons, but with the “monitor reset” command. I’ll take another stab as it must be possible.
I would have thought that whomever added the “GDB Hardware Debugging” functionality to CDT would have added some of these conveniences to the UI. I wonder why they weren’t added?
LikeLike
Tested and verified. Good tutorial anyway.
Compare to other commercial toolchain: Slow, No reset. don’t know how to inspect variables and set breakpoints (seems different from IAR/Keil by popup windows and one-click toggling),
I would rather to debug it in gdb terminal and cross-checking with list files.
I am going to use it to test my C++ demo on KL25Z. Currently, GCC built successful, but LED doesn’t blink. So I do need a debugger to find out why, maybe something wrong with heap?
LikeLike
Hi Allan,
yes, I miss the reset functionality too. Breakpoints are easily set with double clicking on the column left to the source line. Variables are shown in the ‘Variables’ view.
LikeLike
Pingback: DIY Free Toolchain for Kinetis: Part 7 – GNU ARM Eclipse Plugins | MCU on Eclipse
Hi Erich,
I noticed you explicitly selected ‘Standard GDB Hardware Debugging Launcher’.
Please note that the current debugging configuration supported by CDT is based on the DSF infrastructure, and the ‘Standard’ one will probably be marked as deprecated.
My advice is to give DSF a try, I guess it should work for your configurations too. My J-Link plug-in is based on DSF and it seems ok on all available platforms.
LikeLike
At the time of writing of this article, DSF did not work for me. I’ll give it a try.
LikeLike
Pingback: DIY Free Toolchain for Kinetis: Part 8 – Processor Expert, Eclipse and GNU ARM Eclipse Plugins | MCU on Eclipse
Pingback: DIY Free Toolchain for Kinetis: Part 9 – Express Setup in 8 Steps | MCU on Eclipse
Pingback: DIY Free Toolchain for Kinetis: Part 10 – Project Creation with GNU ARM Eclipse 2.1.1 | MCU on Eclipse
The mbed interface is CMSIS-DAP. github.com/mbedmicro/CMSIS-DAP
LikeLike
P&E GDB Server Configuration
I couldn’t get the Activation widget to work, had to call them and found out you must open the GDB server from C:\PEMicro\gdb_server_kinetis\PEGDB\pe_gdb_server.exe – just clicking the program in the Start menu will not work, when you paste the activation code nothing happens.
LikeLike
You mean to active the P&E GDB server? I think I had not to enter any activation code for the free/limited version.
Otherwise this might be a question for P&E?
LikeLike
Pingback: Constructing a Classroom IDE with Eclipse for ARM | MCU on Eclipse
How do I get “Standard GDB Hardware Debugging Launcher”? Your example shows a choice between “Standard GDB Hardware Debugging Launcher” and “GDB (DSF) Hardware Debugging Launcher”. My system gives me a choice between “Legacy GDB Hardware Debugging Launcher” and “GDB (DSF) Hardware Debugging Launcher”. I am using CodeWarrior for MCU Version: 10.5 Build Id:130916 and have tried installing updates. Is “Standard” the same as “Legacy”? A diff here suggests so: https://eclipse.googlesource.com/cdt/org.eclipse.cdt/+/d613b149a06e728ffd000fc9b5f398a542a4e80f%5E%5E!/
LikeLike
Yes, ‘Standard’ is the same as ‘legacy’. They changed that naming in later plugins, probaly just to create more confusion ;-). Seriously, the DSF is the ‘new’ way, so the labeled the ‘old’ one as ‘legacy’.
LikeLike
Pingback: Debug Multiple Boards with GDB at the Same Time | MCU on Eclipse
Hi,
I have bought the TWR-K20D72M evaluation board. An on-board debug circuit (OSJTAG) has been implemented. Have you any idea, how can debug/program with this OSJTAG interface on this DIY Kinetis Tool Chain?
Thanks a lot for your time!
LikeLike
If I remember correctly, the OSJTAG runs an P&E implementation, so you can connect to it with the P&E connection.
LikeLike
Thanks for reply.
I’ll try the P&E connection as soon as i receive the evaluation board. It could be take a lot of time.
LikeLike