
Debugging is usually a ‘stop-inspect-continue’ process. That does not work very well for watching a system which continuously changes its state. For this usually I toggle an LED, or write things to the console to watch with a human eye what is going on. But there is something very powerful in the CodeWarrior debugger too: to display variables and memory content while the target is running.

Variable Live View
Global Variables
The feature works with memory and (global) variables. For example I have a global ‘cnt’ counter variable which counts up and down depending on my system state:

Global Counter Variable
Eclipse only shows me that variable while I’m in its implementation module. In order to have it visible all the time, I add it to the Global Variables:
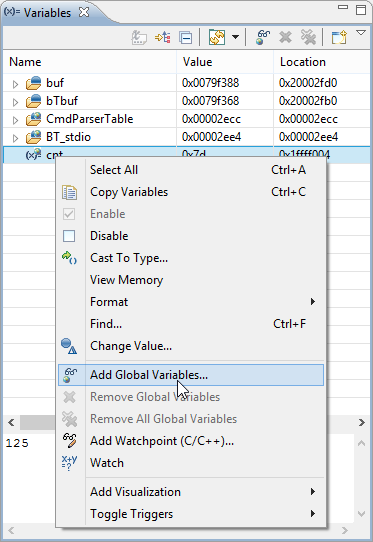
Add Global Variables
Next I select the variable and press OK:

Add Globals
Now if I run my application, that variable is always visible:

Running with Variable shown
Enable Live View
But: the variable value is ‘frozen’ while the debugger is running. I need to stop it to see the new value. To enable the ‘Live View’ to have it updated regularly while the debugger is running, I need to enable the ‘Refresh While Running’ option:

Refresh While Running Enabled
Now the variable content is constantly refreshed while running:

Variable Constantly Refreshed
❗ What happens is: the debugger reads periodically from the target. While this is using ‘free’ cycles (e.g. on BDM), and does not stop the target, this still might be somewhat intrusive. This means: it will impact the execution speed on the target. So be careful about adding too much to watch this way. The other thing is: the feature depends heavily on the speed of the debug connection: While it works with OSBM/OSJAG/OpenSDA, it is really slow. It works better with a faster connection like Segger or P&E USB Multilink.
Live View for Memory
The same thing works for the Memory View where I can enable the ‘Live View’ or ‘Refresh While Running’ mode:

Refresh While Running for Memory
❗ Be aware that for the memory the debugger has to read data, so here you need a fast debug connection. Additionally it seems that the debugger needs to read a whole bunch of memory as I cannot just read a single or set of memory address (I could use a constant pointer instead in the Variables view). As such, Live View in the memory view is really slow, at least with OSBDM/OSJTAG/OpenSDA. Up to the point it is not really useful at all for Memory.
Now the question is: how to configure the refresh period? There is a setting or this in the debug/launch configuration:

Refresh while Running Setting
Summary
That feature helps me to watch directly with the debugger variables. It is understood that things are intrusive, and depends on the connection speed (another good reason to invest a few $ into a good BDM/JTAG wiggler and not rely on OpenSDA/OSBDM/OSJTAG only).
If used wisely (few variables, reasonable refresh time), this feature is very useful for me.
Happy Viewing 🙂

Thank you. I have been really needing this.
LikeLike
That is very helpful to see the running variables. This also seems to help with large structures. Normally when a structure is expanded at a breakpoint it is then collapsed when the debugger leaves the scope of the variable. This is time consuming because the structure then has to be expanded again to see an element when the breakpoint is hit, but with the ‘live view’ the structure stays expanded while running. (this works most of the time, sometimes it will collapse while running but even sometimes is a help on a union of structures and structures with structures and so on…), thank you. Robert
LikeLike
Pingback: Tutorial: ADC with the Freedom Board | MCU on Eclipse
Pingback: Tutorial: FreeMASTER Visualization and Run-Time Debugging | MCU on Eclipse
Thank you very much! I searched 2 weeks for this solution.
LikeLike
Hi Phil,
cool, glad to hear that it was useful 🙂
LikeLike
Wow, your Blog helped me so much with using CW 10.5 for Coldfire! All the tricks you show make my life so much easyer. It’s a pitty the freescale support doesn’t know as much as you do about using CW 10.5.
I was askin myself if it’s also possible to ad public class members to the global view (and refresh them automatically), but I wasn’t able to add them…
is there some trick or does it not work?
LikeLike
Hi Moritz,
thanks for that feedback, appreciated. I think the difference between is that I actually use their products for real stuff and projects, and not just for demos 😉
As for your question: make sure that the variable is really global and not static (make have it with ‘external’ linkage). Otherwise you might not be able to add it the global variables view. I just verified it again with my MCF52259 board/project, and that works for me.
Good luck!
LikeLike
Pingback: Comparing CodeWarrior with Kinetis Design Studio | MCU on Eclipse
Pingback: Automatic Variable, Expression and Memory Display with GDB and Eclipse | MCU on Eclipse
Hello! Thank you very much!
I have a question, how can I do the same thing with eclipse?
My system consists of STM32 – OpenOCD – gdb – Eclipse.
Many thanks in advance.
Giulio
LikeLike
Hi Giulio,
have a look here: https://mcuoneclipse.com/2015/07/14/automatic-variable-expression-and-memory-display-with-gdb-and-eclipse/
I hope this helps,
Erich
LikeLike
when I right click to add global variables, the global variables option is not available. it is a light grey and doesn’t let me click it. any suggestions?
Thanks
-Chris
LikeLike
Hi Chris,
with Eclipse Kepler the variable debugging has been changed. See https://mcuoneclipse.com/2014/03/16/variable-debugging-with-eclipse-kepler/
LikeLike
Hi.
Very useful. Please tell me if I can change the memory content runtime, using Memory View?
Good luck.
LikeLike
Hi Muncho,
I don’t think this is possible, I have not tried it.
LikeLike
Pingback: P&E ARM Cortex-M Debugging with FreeRTOS Thread Awareness and Real Time Expressions for GDB and Eclipse | MCU on Eclipse
I don’t have any of the options you mentioned above like adding global, toggling live view buttons and such, why?
LikeLike
Are you using CodeWarrior? Otherwise this exists for example in MCUXpresso IDE (see https://mcuoneclipse.com/2018/05/20/overview-of-mcuxpresso-ide-v10-2-0/), but this is not part plain-vanilla Eclipse.
LikeLike
Erich Hi, didn’t see your reply, my bad.
I’m using System Workbench for STM32, based on eclipse. Didn’t know there was any other IDE’s on eclipse. Can you elaborate? Are you using MCUXpresso?
LikeLike
Oh yes, there are *plenty* of IDE’s based on Eclipse which is great :-).
The IDE used in this article is CodeWarrior for MCU10.x. A similar functionality exists in MCUXpresso IDE (see https://mcuoneclipse.com/2018/05/20/overview-of-mcuxpresso-ide-v10-2-0/). If you are using System Workbench, then I think you could use the P&E Multilink plugin and then you get that feature too (it is supported in MCUXpresso IDE and Kinetis Design Studio too).
LikeLike
Pingback: Visualizing Global Variables while Target is Running with Eclipse and MCUXpresso IDE | MCU on Eclipse